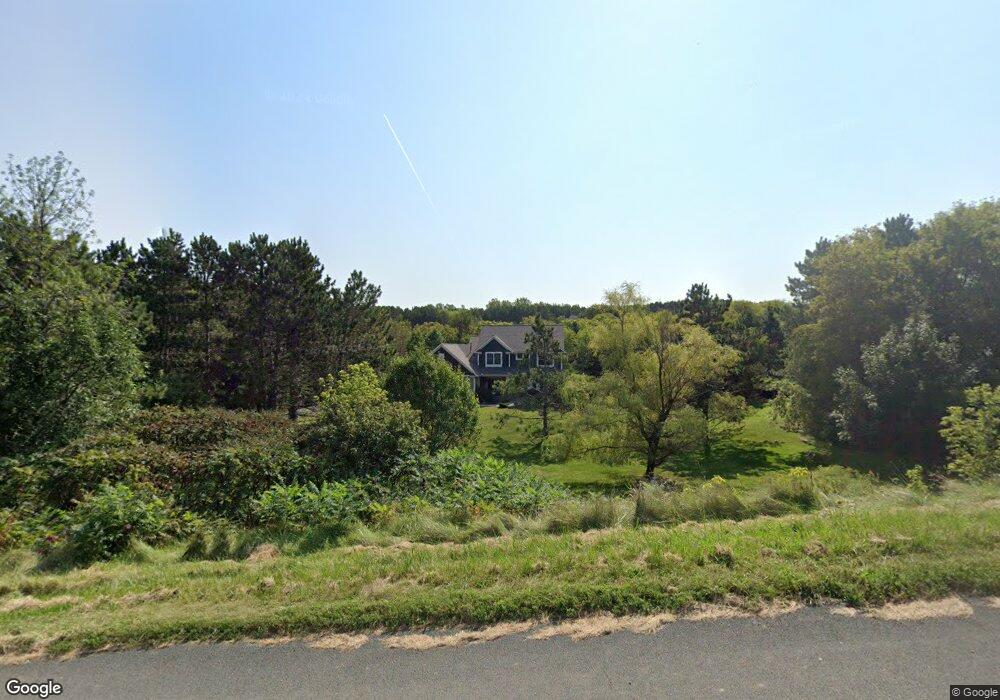
325 Gandy Dancer Cir Hudson, WI 54016
Troy NeighborhoodEstimated Value: $836,179 - $993,000
4
Beds
4
Baths
--
Sq Ft
3.63
Acres
About This Home
This home is located at 325 Gandy Dancer Cir, Hudson, WI 54016 and is currently estimated at $928,795. 325 Gandy Dancer Cir is a home located in St. Croix County with nearby schools including River Crest Elementary School, Hudson Middle School, and Hudson High School.
Ownership History
Date
Name
Owned For
Owner Type
Purchase Details
Closed on
Jul 28, 2016
Sold by
Carlson Brent L and Carlson Kristin M
Bought by
Durch Matthew B and Durch Sara E
Current Estimated Value
Home Financials for this Owner
Home Financials are based on the most recent Mortgage that was taken out on this home.
Original Mortgage
$458,000
Outstanding Balance
$365,431
Interest Rate
3.48%
Mortgage Type
New Conventional
Estimated Equity
$563,364
Purchase Details
Closed on
Dec 27, 2007
Sold by
Derrick Homes Llc
Bought by
Carlson Brent L and Carlson Kristin M
Home Financials for this Owner
Home Financials are based on the most recent Mortgage that was taken out on this home.
Original Mortgage
$417,000
Interest Rate
6.27%
Mortgage Type
Purchase Money Mortgage
Purchase Details
Closed on
Feb 20, 2006
Sold by
Brushy Mound Partners Llp
Bought by
Derrick Homes Llc
Create a Home Valuation Report for This Property
The Home Valuation Report is an in-depth analysis detailing your home's value as well as a comparison with similar homes in the area
Home Values in the Area
Average Home Value in this Area
Purchase History
| Date | Buyer | Sale Price | Title Company |
|---|---|---|---|
| Durch Matthew B | $581,500 | Midland Title | |
| Carlson Brent L | $579,000 | River Valley Abstract & Titl | |
| Derrick Homes Llc | $1,189,000 | None Available |
Source: Public Records
Mortgage History
| Date | Status | Borrower | Loan Amount |
|---|---|---|---|
| Open | Durch Matthew B | $458,000 | |
| Previous Owner | Carlson Brent L | $417,000 |
Source: Public Records
Tax History Compared to Growth
Tax History
| Year | Tax Paid | Tax Assessment Tax Assessment Total Assessment is a certain percentage of the fair market value that is determined by local assessors to be the total taxable value of land and additions on the property. | Land | Improvement |
|---|---|---|---|---|
| 2024 | $79 | $712,400 | $139,500 | $572,900 |
| 2023 | $7,875 | $712,400 | $139,500 | $572,900 |
| 2022 | $8,137 | $712,400 | $139,500 | $572,900 |
| 2021 | $7,728 | $498,700 | $106,300 | $392,400 |
| 2020 | $7,866 | $498,700 | $106,300 | $392,400 |
| 2019 | $7,577 | $498,700 | $106,300 | $392,400 |
| 2018 | $7,277 | $498,700 | $106,300 | $392,400 |
| 2017 | $7,056 | $498,700 | $106,300 | $392,400 |
| 2016 | $7,056 | $498,700 | $106,300 | $392,400 |
| 2015 | $6,421 | $498,700 | $106,300 | $392,400 |
| 2014 | $6,218 | $498,700 | $106,300 | $392,400 |
| 2013 | $6,406 | $498,700 | $106,300 | $392,400 |
Source: Public Records
Map
Nearby Homes
- 342 Soo Line Rd
- 323 Empire Builder
- 320 Shelby Court Lot 34
- 312 Shelby Court Lot 32
- 316 Shelby Court Lot 33
- 380 Cedar Ct
- 504 E Cove Rd
- 416 Moelter Ln
- xxx Valerie Ave
- 433 Sunset Dr
- 406 S Fork Dr
- 326 S Cove Rd
- 268 Saint Andrews Dr
- 266 Troon Ct
- 316 Saint Annes Pkwy
- XXX Tower Rd
- 718 Crest Curve
- 715 Mount Curve Ct
- XXX Plainview Dr
- 2927 Thompson Dr
- 322 Gandy Dancer Cir
- 321 Gandy Dancer Cir
- 336 Soo Line Rd
- 318 Gandy Dancer Cir
- 315 Gandy Dancer Cir
- 316 Gandy Dancer Cir
- 341 Soo Line Rd
- 340 Soo Line Rd
- 345 Soo Line Rd
- 322 Empire Builder
- 344 Soo Line Rd
- 339 Soo Line Rd
- 320 Empire Builder
- 306 Empire Builder
- 346 Soo Line Rd
- LOT 85 Empire Builder Dr
- 351 Soo Line Rd
- 337 Soo Line Rd
- 332 Soo Line Rd
- 314 Empire Builder