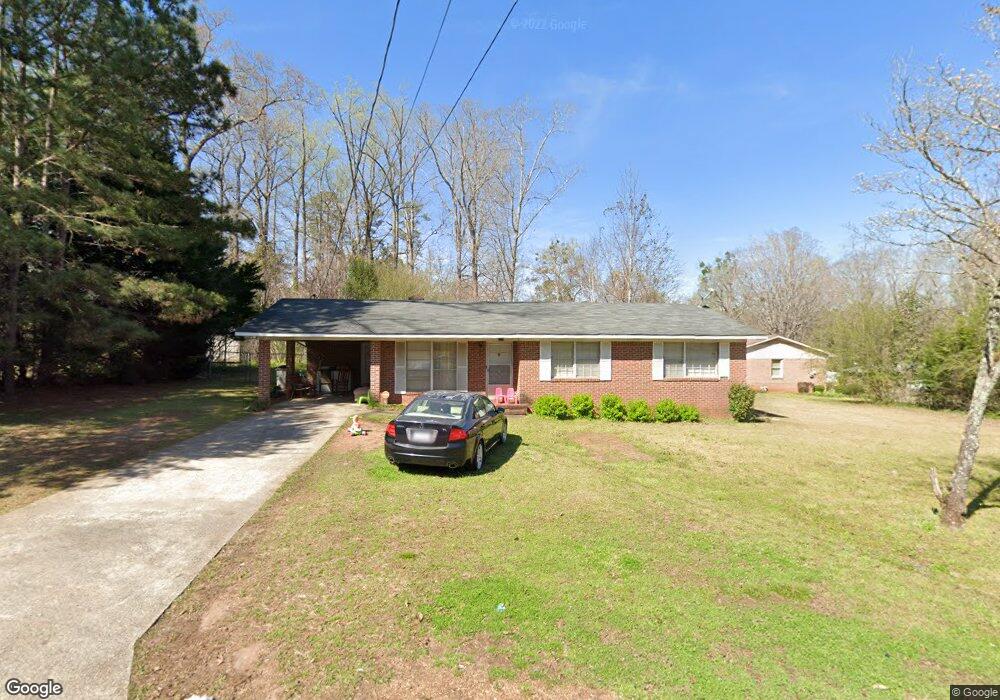
325 Hickory Terrace Lagrange, GA 30241
Estimated Value: $197,000 - $210,000
3
Beds
2
Baths
1,473
Sq Ft
$137/Sq Ft
Est. Value
About This Home
This home is located at 325 Hickory Terrace, Lagrange, GA 30241 and is currently estimated at $201,636, approximately $136 per square foot. 325 Hickory Terrace is a home located in Troup County with nearby schools including Franklin Forest Elementary School, Hollis Hand Elementary School, and Ethel W. Kight Elementary School.
Ownership History
Date
Name
Owned For
Owner Type
Purchase Details
Closed on
Jun 29, 2005
Sold by
Carter Carroll L
Bought by
Anderson Investment Grp Llc
Current Estimated Value
Home Financials for this Owner
Home Financials are based on the most recent Mortgage that was taken out on this home.
Original Mortgage
$36,905
Interest Rate
5.54%
Mortgage Type
New Conventional
Purchase Details
Closed on
Jun 9, 2004
Sold by
Williams Carl S and Williams Mary B
Bought by
Jean W Carter
Purchase Details
Closed on
Jan 1, 1984
Sold by
Teresa Jas and Teresa Hester
Bought by
Williams Carl S and Williams Mary B
Purchase Details
Closed on
Jul 7, 1975
Sold by
Teresa James and Teresa Hester
Bought by
Teresa Jas and Teresa Hester
Purchase Details
Closed on
Jun 24, 1974
Sold by
Horne
Bought by
Teresa James and Teresa Hester
Purchase Details
Closed on
Jan 1, 1972
Sold by
Davis
Bought by
Horne
Purchase Details
Closed on
Mar 1, 1961
Sold by
Park Hill Inc
Bought by
Davis
Create a Home Valuation Report for This Property
The Home Valuation Report is an in-depth analysis detailing your home's value as well as a comparison with similar homes in the area
Home Values in the Area
Average Home Value in this Area
Purchase History
| Date | Buyer | Sale Price | Title Company |
|---|---|---|---|
| Anderson Investment Grp Llc | $79,000 | -- | |
| Jean W Carter | -- | -- | |
| Williams Carl S | $52,000 | -- | |
| Teresa Jas | -- | -- | |
| Teresa James | -- | -- | |
| Horne | -- | -- | |
| Davis | -- | -- |
Source: Public Records
Mortgage History
| Date | Status | Borrower | Loan Amount |
|---|---|---|---|
| Closed | Anderson Investment Grp Llc | $36,905 |
Source: Public Records
Tax History Compared to Growth
Tax History
| Year | Tax Paid | Tax Assessment Tax Assessment Total Assessment is a certain percentage of the fair market value that is determined by local assessors to be the total taxable value of land and additions on the property. | Land | Improvement |
|---|---|---|---|---|
| 2024 | $1,510 | $55,384 | $10,000 | $45,384 |
| 2023 | $1,378 | $50,544 | $10,000 | $40,544 |
| 2022 | $1,331 | $47,704 | $10,000 | $37,704 |
| 2021 | $1,015 | $33,648 | $8,000 | $25,648 |
| 2020 | $1,015 | $33,648 | $8,000 | $25,648 |
| 2019 | $820 | $27,196 | $6,068 | $21,128 |
| 2018 | $820 | $27,196 | $6,068 | $21,128 |
| 2017 | $820 | $27,196 | $6,068 | $21,128 |
| 2016 | $799 | $26,483 | $6,068 | $20,415 |
| 2015 | $800 | $26,483 | $6,068 | $20,415 |
| 2014 | $769 | $25,409 | $6,068 | $19,341 |
| 2013 | -- | $26,859 | $6,068 | $20,791 |
Source: Public Records
Map
Nearby Homes
- 109 Dogwood Dr
- 706 N Harlem Cir
- 606 S Harlem Cir
- 600 S Harlem Cir
- 608 S Harlem Cir
- 616 S Harlem Cir
- 618 S Harlem Cir
- 131 Foch St
- 600,606,608,616 S Harlem
- 900 North St
- 110 Russell St
- 806 New Franklin Rd
- 219 Banks St
- 301 E Bacon St
- 204 Colonial St
- 109 Thomas St
- 0 Ridley Ave Unit 10550104
- 114 Briarcliff Rd
- 609 Ridley Ave
- 707 Ridley Ave
- 335 Park Hill Dr
- 346 Laurel Ln
- 326 Hickory Terrace Unit 15
- 326 Hickory Terrace
- 322 Hickory Terrace
- 331 Park Hill Dr
- 328 Hickory Terrace Unit 16
- 328 Hickory Terrace
- 342 Laurel Ln
- 351 Laurel Ln
- 318 Hickory Terrace
- 347 Laurel Ln
- 329 Park Hill Dr
- 343 Laurel Ln
- 338 Laurel Ln
- 314 Hickory Terrace
- 330 Hickory Terrace
- 332 Park Hill Dr
- 328 Park Hill Dr
- 356 Hickory Terrace