Estimated Value: $401,000 - $427,000
4
Beds
2
Baths
2,300
Sq Ft
$179/Sq Ft
Est. Value
About This Home
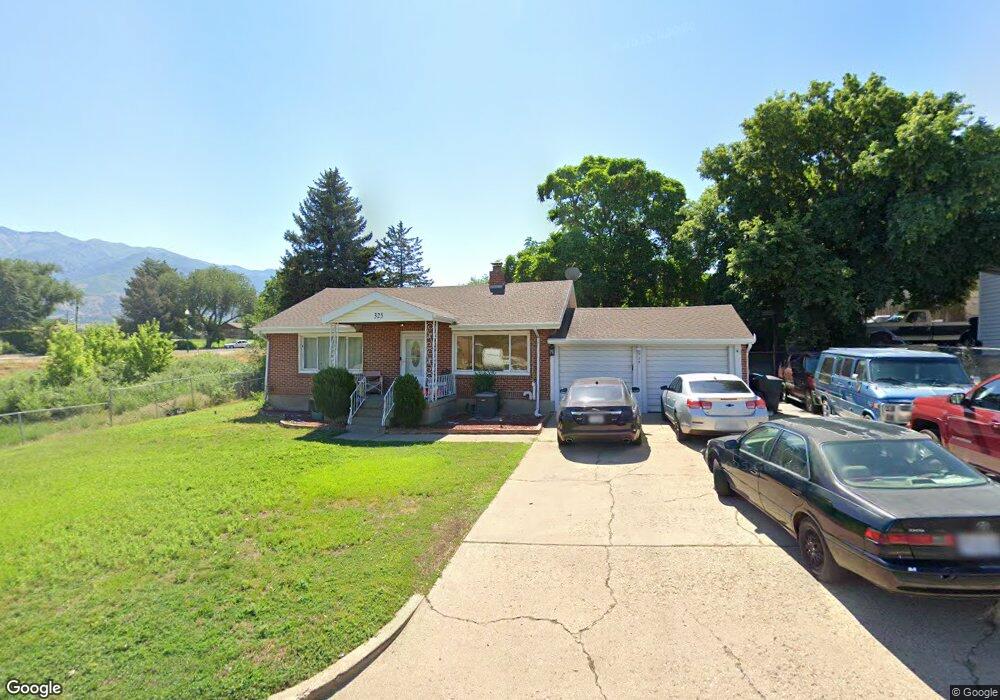
This home is located at 325 Highland Dr, Ogden, UT 84405 and is currently estimated at $412,646, approximately $179 per square foot. 325 Highland Dr is a home located in Weber County with nearby schools including Washington Terrace School, T.H. Bell Junior High School, and Bonneville High School.
Ownership History
Date
Name
Owned For
Owner Type
Purchase Details
Closed on
Jan 19, 2025
Sold by
Grissett Brandon D
Bought by
Grissett Brandon D and Grissett Chasity
Current Estimated Value
Purchase Details
Closed on
Aug 23, 2014
Sold by
Az Building Maintenance Llc
Bought by
Az Building Maintenance Llc
Purchase Details
Closed on
Aug 21, 2014
Sold by
Secretary Of Hud
Bought by
Az Building Maintenance Llc
Purchase Details
Closed on
Feb 12, 2014
Sold by
Wells Fargo Bank Na
Bought by
The Secretary Of Hud
Purchase Details
Closed on
Feb 24, 2005
Sold by
Love Margaret S and Love Fairen
Bought by
Lund Curtiss L and Lund Rose M
Home Financials for this Owner
Home Financials are based on the most recent Mortgage that was taken out on this home.
Original Mortgage
$117,846
Interest Rate
5.73%
Mortgage Type
FHA
Create a Home Valuation Report for This Property
The Home Valuation Report is an in-depth analysis detailing your home's value as well as a comparison with similar homes in the area
Home Values in the Area
Average Home Value in this Area
Purchase History
| Date | Buyer | Sale Price | Title Company |
|---|---|---|---|
| Grissett Brandon D | -- | None Listed On Document | |
| Az Building Maintenance Llc | -- | Bonneville Superior Title Co | |
| Az Building Maintenance Llc | -- | Bonneville Superior Title Co | |
| The Secretary Of Hud | -- | Inwest Title | |
| Wells Fargo Bank Na | $112,200 | Etitle Insurance Agency | |
| Lund Curtiss L | -- | First American Title |
Source: Public Records
Mortgage History
| Date | Status | Borrower | Loan Amount |
|---|---|---|---|
| Previous Owner | Lund Curtiss L | $117,846 | |
| Closed | Lund Curtiss L | $5,925 |
Source: Public Records
Tax History
| Year | Tax Paid | Tax Assessment Tax Assessment Total Assessment is a certain percentage of the fair market value that is determined by local assessors to be the total taxable value of land and additions on the property. | Land | Improvement |
|---|---|---|---|---|
| 2025 | $2,674 | $221,105 | $61,741 | $159,364 |
| 2024 | $2,565 | $215,599 | $61,625 | $153,974 |
| 2023 | $2,365 | $197,450 | $61,832 | $135,618 |
| 2022 | $2,332 | $201,300 | $53,701 | $147,599 |
| 2021 | $1,955 | $300,000 | $51,931 | $248,069 |
| 2020 | $1,807 | $253,000 | $42,521 | $210,479 |
| 2019 | $1,785 | $236,000 | $37,730 | $198,270 |
| 2018 | $1,662 | $208,000 | $37,730 | $170,270 |
| 2017 | $1,582 | $187,000 | $33,986 | $153,014 |
| 2016 | $1,418 | $89,162 | $16,796 | $72,366 |
| 2015 | $1,435 | $89,162 | $16,796 | $72,366 |
| 2014 | $1,210 | $71,965 | $16,796 | $55,169 |
Source: Public Records
Map
Nearby Homes
- 403 Highland Dr
- 224 W 4600 S
- 310 W 4675 S
- 80 W 4300 S
- 431 W 4650 S
- 4689 S 275 W
- 339 W 4675 S
- 4370 S 175 E
- 137 Country Club Dr
- 4856 S 300 W
- 4375 Weber River Dr Unit 44
- 4816 S 525 W
- 277 E 4300 S
- 291 E 4300 S
- 4546 S 300 E
- 380 W 4900 S Unit 11
- 323 E 4575 S
- 4404 S 375 E
- 4958 S 475 W
- 4024 S Burch Creek Way
- 337 Highland Dr
- 359 Highland Dr
- 367 W Highland Dr
- 4301 S 300 W
- 367 Highland Dr
- 332 Highland Dr
- 348 Highland Dr
- 481 W Highland Dr
- 321 Highland Dr
- 4375 S 300 W
- 373 Highland Dr
- 320 Cherry Dr
- 406 Highland Dr
- 327 Cherry Dr
- 4425 S 300 W
- 377 Highland Dr
- 4175 S 300 W
- 339 Cherry Dr
- 338 Cherry Dr
- 4351 S 275 W
Your Personal Tour Guide
Ask me questions while you tour the home.