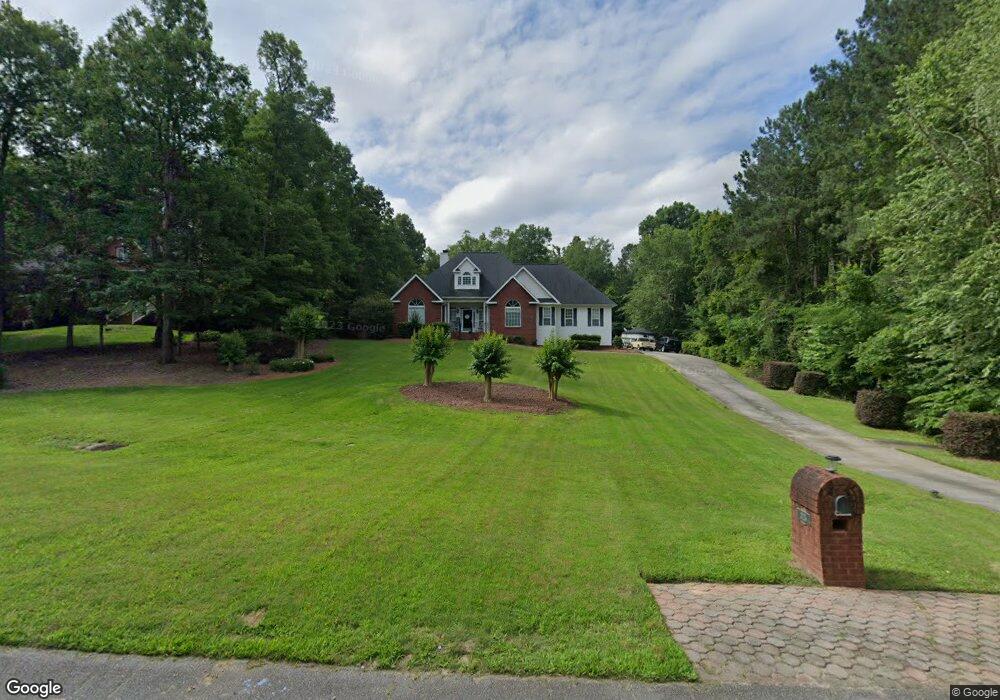
325 Hillridge Cove Unit 212 Lizella, GA 31052
Estimated Value: $337,442 - $434,000
3
Beds
2
Baths
2,883
Sq Ft
$128/Sq Ft
Est. Value
About This Home
This home is located at 325 Hillridge Cove Unit 212, Lizella, GA 31052 and is currently estimated at $370,111, approximately $128 per square foot. 325 Hillridge Cove Unit 212 is a home located in Bibb County with nearby schools including Skyview Elementary School, Rutland Middle School, and Rutland High School.
Ownership History
Date
Name
Owned For
Owner Type
Purchase Details
Closed on
May 22, 2019
Sold by
Barksdale Linda M and Barksdale Dale
Bought by
Roberts Johnny Lee
Current Estimated Value
Home Financials for this Owner
Home Financials are based on the most recent Mortgage that was taken out on this home.
Original Mortgage
$234,700
Outstanding Balance
$205,930
Interest Rate
4.1%
Mortgage Type
VA
Estimated Equity
$164,181
Purchase Details
Closed on
May 11, 2018
Sold by
Farr Charles Stephen and Farr Scarlett L
Bought by
Barksdale Linda M and Barksdale Dale
Home Financials for this Owner
Home Financials are based on the most recent Mortgage that was taken out on this home.
Original Mortgage
$144,000
Interest Rate
4.44%
Mortgage Type
New Conventional
Purchase Details
Closed on
Feb 26, 1999
Bought by
Farr Charles S and Farr Scarlett L
Create a Home Valuation Report for This Property
The Home Valuation Report is an in-depth analysis detailing your home's value as well as a comparison with similar homes in the area
Home Values in the Area
Average Home Value in this Area
Purchase History
| Date | Buyer | Sale Price | Title Company |
|---|---|---|---|
| Roberts Johnny Lee | $234,000 | None Available | |
| Barksdale Linda M | $230,000 | None Available | |
| Farr Charles S | $183,500 | -- |
Source: Public Records
Mortgage History
| Date | Status | Borrower | Loan Amount |
|---|---|---|---|
| Open | Roberts Johnny Lee | $234,700 | |
| Previous Owner | Barksdale Linda M | $144,000 |
Source: Public Records
Tax History Compared to Growth
Tax History
| Year | Tax Paid | Tax Assessment Tax Assessment Total Assessment is a certain percentage of the fair market value that is determined by local assessors to be the total taxable value of land and additions on the property. | Land | Improvement |
|---|---|---|---|---|
| 2024 | $2,390 | $101,121 | $10,780 | $90,341 |
| 2023 | $1,933 | $101,121 | $10,780 | $90,341 |
| 2022 | $3,353 | $103,837 | $15,492 | $88,345 |
| 2021 | $3,061 | $87,563 | $15,492 | $72,071 |
| 2020 | $3,128 | $87,563 | $15,492 | $72,071 |
| 2019 | $3,337 | $85,238 | $15,492 | $69,746 |
| 2018 | $4,813 | $84,289 | $15,492 | $68,797 |
| 2017 | $2,636 | $77,348 | $15,492 | $61,856 |
| 2016 | $2,434 | $77,348 | $15,492 | $61,856 |
| 2015 | $3,445 | $77,348 | $15,492 | $61,856 |
| 2014 | $4,209 | $92,812 | $15,492 | $77,320 |
Source: Public Records
Map
Nearby Homes
- 420 Lake Waters Pointe
- 416 Lake Waters Pointe
- 512 Spring Run
- 417 Lake Water Pointe
- 416 Lake Water Pointe
- 420 Lake Water Pointe
- 324 Old Mast Cove
- 313 Old Mast Cove
- 309 Old Mast Cove
- 305 Old Mast Cove
- 349 Hillridge Cove
- 509 Spring Run
- 513 Spring Run
- 508 Spring Run
- 505 Spring Run
- 504 Spring Run
- 417 Lake Waters Pointe
- 112 Waters Pointe
- 116 Waters Pointe
- 132 Waters Pointe
- 325 Hillridge Cove
- 323 Hillridge Cove
- 321 Hillridge Cove
- 425 Lake Water Point
- 329 Hillridge Cove
- 321 Old Mast Cove
- 329 Old Mast Cove
- 319 Hillridge Cove
- 330 Hillridge Cove
- 326 Hillridge Cove
- 331 Hillridge Cove
- 317 Old Mast Cove
- 412 Lake Water Point
- 324 Hillridge Cove
- 520 Spring Run
- 520 Spring Run Unit 42
- 332 Hillridge Cove
- 332 Hillridge Cove Unit 237
- 317 Hillridge Cove
- 516 Spring Run