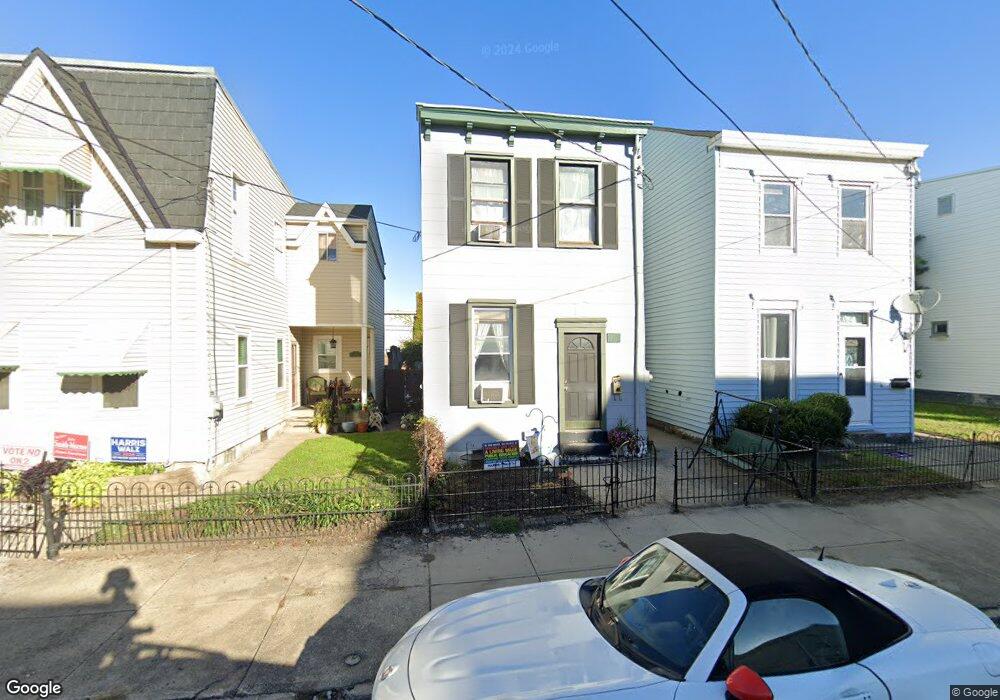
325 Hodge St Newport, KY 41071
Estimated Value: $125,000 - $178,000
3
Beds
2
Baths
1,164
Sq Ft
$132/Sq Ft
Est. Value
About This Home
This home is located at 325 Hodge St, Newport, KY 41071 and is currently estimated at $153,229, approximately $131 per square foot. 325 Hodge St is a home located in Campbell County with nearby schools including Newport Primary School, Newport Intermediate School, and Newport High School.
Ownership History
Date
Name
Owned For
Owner Type
Purchase Details
Closed on
Jul 21, 2005
Sold by
Flores Juan J and Flores Jeanine N
Bought by
Palmisano Gregory P and Palmisano Maria G
Current Estimated Value
Home Financials for this Owner
Home Financials are based on the most recent Mortgage that was taken out on this home.
Original Mortgage
$57,510
Outstanding Balance
$32,422
Interest Rate
6.92%
Mortgage Type
Adjustable Rate Mortgage/ARM
Estimated Equity
$120,807
Purchase Details
Closed on
Dec 9, 2004
Sold by
Hud
Bought by
Flores Juan J
Purchase Details
Closed on
Apr 5, 2004
Sold by
Witherspoon Donna S and Witherspoon Clarence
Bought by
Hud
Purchase Details
Closed on
May 18, 2000
Sold by
Wilson Darin E
Bought by
Witherspoon Donna S
Home Financials for this Owner
Home Financials are based on the most recent Mortgage that was taken out on this home.
Original Mortgage
$49,974
Interest Rate
8.2%
Mortgage Type
FHA
Create a Home Valuation Report for This Property
The Home Valuation Report is an in-depth analysis detailing your home's value as well as a comparison with similar homes in the area
Home Values in the Area
Average Home Value in this Area
Purchase History
| Date | Buyer | Sale Price | Title Company |
|---|---|---|---|
| Palmisano Gregory P | $63,900 | Vintage Title Agency | |
| Flores Juan J | $34,000 | First American Title Ins Co | |
| Hud | $23,334 | -- | |
| Witherspoon Donna S | $50,000 | -- |
Source: Public Records
Mortgage History
| Date | Status | Borrower | Loan Amount |
|---|---|---|---|
| Open | Palmisano Gregory P | $57,510 | |
| Previous Owner | Witherspoon Donna S | $49,974 |
Source: Public Records
Tax History Compared to Growth
Tax History
| Year | Tax Paid | Tax Assessment Tax Assessment Total Assessment is a certain percentage of the fair market value that is determined by local assessors to be the total taxable value of land and additions on the property. | Land | Improvement |
|---|---|---|---|---|
| 2024 | $279 | $72,500 | $20,000 | $52,500 |
| 2023 | $228 | $57,700 | $3,600 | $54,100 |
| 2022 | $299 | $57,700 | $3,600 | $54,100 |
| 2021 | $306 | $57,700 | $3,600 | $54,100 |
| 2020 | $311 | $57,700 | $3,600 | $54,100 |
| 2019 | $305 | $55,800 | $3,500 | $52,300 |
| 2018 | $301 | $55,800 | $3,500 | $52,300 |
| 2017 | $302 | $55,800 | $3,500 | $52,300 |
| 2016 | $275 | $55,800 | $0 | $0 |
| 2015 | $313 | $63,900 | $0 | $0 |
| 2014 | $307 | $63,900 | $0 | $0 |
Source: Public Records
Map
Nearby Homes