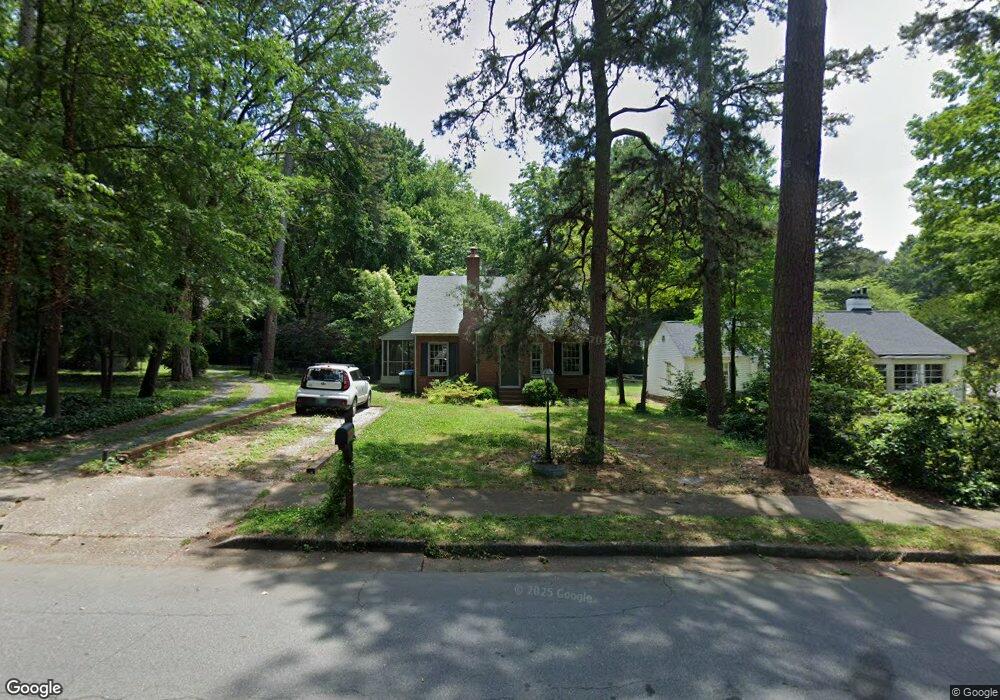
325 Lantz Ave Salisbury, NC 28144
Estimated Value: $212,000 - $281,000
2
Beds
1
Bath
1,088
Sq Ft
$234/Sq Ft
Est. Value
About This Home
This home is located at 325 Lantz Ave, Salisbury, NC 28144 and is currently estimated at $254,201, approximately $233 per square foot. 325 Lantz Ave is a home located in Rowan County with nearby schools including Carroll T Overton Elementary School, Knox Middle School, and North Rowan Middle School.
Ownership History
Date
Name
Owned For
Owner Type
Purchase Details
Closed on
Mar 8, 2021
Sold by
Matthews Gregory Robert and Matthews Gwen Speeler
Bought by
Poston Joseph Paul
Current Estimated Value
Home Financials for this Owner
Home Financials are based on the most recent Mortgage that was taken out on this home.
Original Mortgage
$100,000
Interest Rate
2.9%
Mortgage Type
New Conventional
Purchase Details
Closed on
Mar 26, 2018
Sold by
Alfred N Natelia
Bought by
Matthews Gregory and Matthews Gwen
Home Financials for this Owner
Home Financials are based on the most recent Mortgage that was taken out on this home.
Original Mortgage
$18,000
Interest Rate
4.45%
Purchase Details
Closed on
Sep 5, 2008
Sold by
Hatcher Franklin Adair and Hatcher Linda Thompson
Bought by
Matthews Gregory R and Matthews Gwen S
Home Financials for this Owner
Home Financials are based on the most recent Mortgage that was taken out on this home.
Original Mortgage
$89,000
Interest Rate
6.61%
Mortgage Type
Purchase Money Mortgage
Create a Home Valuation Report for This Property
The Home Valuation Report is an in-depth analysis detailing your home's value as well as a comparison with similar homes in the area
Home Values in the Area
Average Home Value in this Area
Purchase History
| Date | Buyer | Sale Price | Title Company |
|---|---|---|---|
| Poston Joseph Paul | $220,000 | None Available | |
| Matthews Gregory | -- | -- | |
| Matthews Gregory R | $85,000 | None Available |
Source: Public Records
Mortgage History
| Date | Status | Borrower | Loan Amount |
|---|---|---|---|
| Previous Owner | Poston Joseph Paul | $100,000 | |
| Previous Owner | Matthews Gregory | $18,000 | |
| Previous Owner | Matthews Gregory | -- | |
| Previous Owner | Matthews Gregory R | $89,000 |
Source: Public Records
Tax History Compared to Growth
Tax History
| Year | Tax Paid | Tax Assessment Tax Assessment Total Assessment is a certain percentage of the fair market value that is determined by local assessors to be the total taxable value of land and additions on the property. | Land | Improvement |
|---|---|---|---|---|
| 2025 | $1,726 | $144,293 | $15,600 | $128,693 |
| 2024 | $1,726 | $144,293 | $15,600 | $128,693 |
| 2023 | $1,726 | $144,293 | $15,600 | $128,693 |
| 2022 | $1,174 | $85,217 | $13,000 | $72,217 |
| 2021 | $1,174 | $85,217 | $13,000 | $72,217 |
| 2020 | $1,174 | $85,217 | $13,000 | $72,217 |
| 2019 | $1,174 | $85,217 | $13,000 | $72,217 |
| 2018 | $969 | $71,285 | $13,000 | $58,285 |
| 2017 | $963 | $71,285 | $13,000 | $58,285 |
| 2016 | $937 | $71,285 | $13,000 | $58,285 |
| 2015 | $943 | $71,285 | $13,000 | $58,285 |
| 2014 | $961 | $73,554 | $13,000 | $60,554 |
Source: Public Records
Map
Nearby Homes
- 636 Statesville Blvd
- 151 E Corriher Ave
- 0000 Hogans Valley Way Unit 181
- 1132 Arbor Dr
- 1218 Forestdale Dr
- 1300 Larchmont Place Unit 208
- 1300 Larchmont Place
- 1300 Larchmont Place Unit 210
- 1625 Emerald Ave
- 515 Riviera Dr
- 519 Riviera Dr
- 523 Riviera Dr
- 1317 Arden Dr
- 307 Messner St
- 0 Hogans Valley Way Unit CAR4284662
- 0 Hogans Valley Way Unit CAR4284649
- 205 Windsor Dr
- 1728 Colony Rd
- 1005 Mocksville Ave
- 1441 Statesville Blvd
- 327 Lantz Ave
- 317 Lantz Ave
- 311 Lantz Ave
- 320 W Corriher Ave
- 328 W Corriher Ave
- 318 W Corriher Ave
- 324 Lantz Ave
- 328 Lantz Ave
- 312 W Corriher Ave
- 2015 Yost St
- 2009 Yost St
- 303 Lantz Ave
- 312 Lantz Ave
- 308 W Corriher Ave
- 400 Lantz Ave
- 2005 Yost St
- 2003 Yost St
- 300 Lantz Ave
- 304 W Corriher Ave
- 2113 Yost St