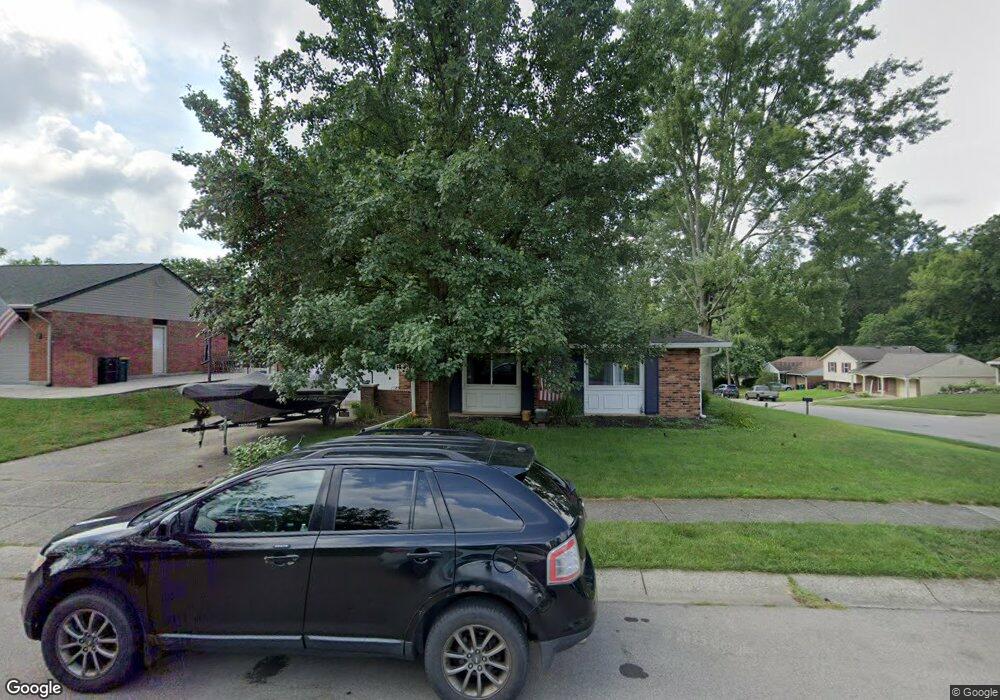
325 Larchway Ln Springboro, OH 45066
Estimated Value: $275,000 - $293,000
3
Beds
2
Baths
1,500
Sq Ft
$191/Sq Ft
Est. Value
About This Home
This home is located at 325 Larchway Ln, Springboro, OH 45066 and is currently estimated at $286,120, approximately $190 per square foot. 325 Larchway Ln is a home located in Warren County with nearby schools including Clearcreek Elementary School, Springboro Intermediate School, and Dennis Elementary School.
Ownership History
Date
Name
Owned For
Owner Type
Purchase Details
Closed on
Jun 28, 2007
Sold by
Zaremba Kmucha Marie A and Kmucha Jeffrey
Bought by
Newby Melissa A
Current Estimated Value
Home Financials for this Owner
Home Financials are based on the most recent Mortgage that was taken out on this home.
Original Mortgage
$134,900
Outstanding Balance
$83,964
Interest Rate
6.42%
Mortgage Type
Purchase Money Mortgage
Estimated Equity
$202,156
Purchase Details
Closed on
Feb 2, 1994
Sold by
Frederick Cramer and Frederick T.
Bought by
Frederick Cramer and Frederick T.
Purchase Details
Closed on
Jun 5, 1990
Sold by
Weller Weller and Weller James C
Bought by
Frederick Cramer and Frederick T.
Create a Home Valuation Report for This Property
The Home Valuation Report is an in-depth analysis detailing your home's value as well as a comparison with similar homes in the area
Home Values in the Area
Average Home Value in this Area
Purchase History
| Date | Buyer | Sale Price | Title Company |
|---|---|---|---|
| Newby Melissa A | $134,900 | Landmark Title Agency South | |
| Frederick Cramer | -- | -- | |
| Frederick Cramer | $78,000 | -- |
Source: Public Records
Mortgage History
| Date | Status | Borrower | Loan Amount |
|---|---|---|---|
| Open | Newby Melissa A | $134,900 |
Source: Public Records
Tax History Compared to Growth
Tax History
| Year | Tax Paid | Tax Assessment Tax Assessment Total Assessment is a certain percentage of the fair market value that is determined by local assessors to be the total taxable value of land and additions on the property. | Land | Improvement |
|---|---|---|---|---|
| 2024 | $3,085 | $79,000 | $26,250 | $52,750 |
| 2023 | $2,616 | $61,439 | $16,520 | $44,919 |
| 2022 | $2,578 | $61,439 | $16,520 | $44,919 |
| 2021 | $2,399 | $61,439 | $16,520 | $44,919 |
| 2020 | $2,326 | $52,066 | $14,000 | $38,066 |
| 2019 | $2,144 | $52,066 | $14,000 | $38,066 |
| 2018 | $2,146 | $52,066 | $14,000 | $38,066 |
| 2017 | $1,974 | $43,141 | $11,771 | $31,371 |
| 2016 | $2,058 | $43,141 | $11,771 | $31,371 |
| 2015 | $2,094 | $43,141 | $11,771 | $31,371 |
| 2014 | $2,094 | $41,480 | $11,320 | $30,160 |
| 2013 | $2,092 | $51,310 | $14,000 | $37,310 |
Source: Public Records
Map
Nearby Homes
- 210 Evergreen Dr
- 360 Wellington Way
- 131 Queen Ann Ct
- 510 Royal Springs Dr
- 51 Pheasant Run Cir
- 23 Pheasant Run Cir Unit 9A
- 80 Mcvey Place
- Calvin Plan at Wadestone - Designer Collection
- Charles Plan at Eastbrook Farms - Designer Collection
- Charles Plan at Wadestone - Designer Collection
- Huxley Plan at Wadestone - Masterpiece Collection
- Wyatt Plan at Wadestone - Designer Collection
- Calvin Plan at Eastbrook Farms - Designer Collection
- Winston Plan at Wadestone - Designer Collection
- Grandin Plan at Eastbrook Farms - Designer Collection
- Magnolia Plan at Eastbrook Farms - Designer Collection
- Avery Plan at Eastbrook Farms - Designer Collection
- Rhodes Plan at Wadestone - Masterpiece Collection
- Finley Plan at Wadestone - Masterpiece Collection
- Blair Plan at Wadestone - Designer Collection
- 315 Larchway Ln
- 115 Bramblebush Ln
- 125 Bramblebush Ln
- 305 Larchway Ln
- 110 Bramblebush Ln
- 200 Bramblebush Ln
- 105 Bramble Bush Ln
- 225 Teakwood Ln
- 105 Bramblebush Ln
- 135 Bramblebush Ln
- 215 Teakwood Ln
- 95 Bramblebush Ln
- 195 Bramble Bush Ln
- 100 Bramblebush Ln
- 195 Bramblebush Ln
- 300 Larchway Ln
- 210 Bramblebush Ln
- 85 Bramble Bush Ln
- 205 Teakwood Ln
- 100 Timberwood Ln