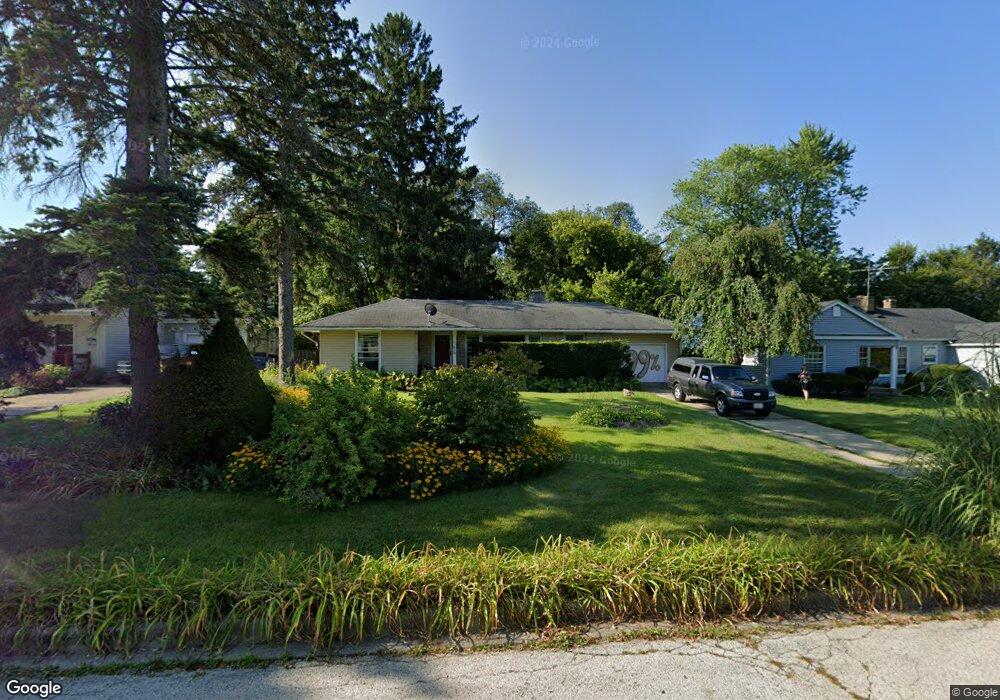
325 Longview Rd Waukegan, IL 60087
Greenwood Park NeighborhoodEstimated Value: $292,000 - $338,000
3
Beds
2
Baths
2,004
Sq Ft
$156/Sq Ft
Est. Value
About This Home
This home is located at 325 Longview Rd, Waukegan, IL 60087 and is currently estimated at $312,596, approximately $155 per square foot. 325 Longview Rd is a home located in Lake County with nearby schools including Greenwood Elementary School, Edith M Smith Middle School, and Waukegan High School.
Ownership History
Date
Name
Owned For
Owner Type
Purchase Details
Closed on
Nov 20, 2009
Sold by
Bolotnik Sandy and Bolotnik Christine C
Bought by
Bolotnik Alexander William and Bolotnik Sandy
Current Estimated Value
Home Financials for this Owner
Home Financials are based on the most recent Mortgage that was taken out on this home.
Original Mortgage
$132,000
Outstanding Balance
$86,411
Interest Rate
5.05%
Mortgage Type
New Conventional
Estimated Equity
$226,185
Purchase Details
Closed on
Apr 16, 1998
Sold by
Federal Home Loan Mortgage Corporation
Bought by
Bolotnik Sandy and Stramaglio Christine C
Home Financials for this Owner
Home Financials are based on the most recent Mortgage that was taken out on this home.
Original Mortgage
$73,500
Interest Rate
7.18%
Create a Home Valuation Report for This Property
The Home Valuation Report is an in-depth analysis detailing your home's value as well as a comparison with similar homes in the area
Home Values in the Area
Average Home Value in this Area
Purchase History
| Date | Buyer | Sale Price | Title Company |
|---|---|---|---|
| Bolotnik Alexander William | -- | Chicago Title Insurance Co | |
| Bolotnik Sandy | $92,000 | Collar Counties Title Plant |
Source: Public Records
Mortgage History
| Date | Status | Borrower | Loan Amount |
|---|---|---|---|
| Open | Bolotnik Alexander William | $132,000 | |
| Closed | Bolotnik Sandy | $73,500 |
Source: Public Records
Tax History Compared to Growth
Tax History
| Year | Tax Paid | Tax Assessment Tax Assessment Total Assessment is a certain percentage of the fair market value that is determined by local assessors to be the total taxable value of land and additions on the property. | Land | Improvement |
|---|---|---|---|---|
| 2024 | $5,306 | $80,090 | $18,634 | $61,456 |
| 2023 | $5,545 | $72,269 | $16,814 | $55,455 |
| 2022 | $5,545 | $67,717 | $15,597 | $52,120 |
| 2021 | $5,185 | $60,734 | $13,912 | $46,822 |
| 2020 | $5,167 | $56,581 | $12,961 | $43,620 |
| 2019 | $5,104 | $51,848 | $11,877 | $39,971 |
| 2018 | $5,651 | $50,087 | $16,811 | $33,276 |
| 2017 | $5,450 | $44,313 | $14,873 | $29,440 |
| 2016 | $5,023 | $38,506 | $12,924 | $25,582 |
| 2015 | $4,808 | $34,463 | $11,567 | $22,896 |
| 2014 | $4,149 | $30,061 | $9,202 | $20,859 |
| 2012 | $5,362 | $32,569 | $9,970 | $22,599 |
Source: Public Records
Map
Nearby Homes
- 2246 Alta Vista Dr
- 2213 Alta Vista Dr
- 2232 Walnut St
- 301 W Eagle Ct
- 616 W Keith Ave
- 1905 Linden Ave
- 0 Traditions Dr
- 1018 W Atlantic Ave
- 1336 N Ash St
- 1335 Chestnut St
- 37231 N Ganster Rd
- 1312 N Linden Ave
- 1110 N Ash St
- 1105 Woodlawn Cir
- 415 W Ridgeland Ave
- 1504 W Glen Flora Ave
- 2350 N Lewis Ave
- 1612 Whitney St
- 918 N Ash St
- 2613 N Lewis Ave
- 321 Longview Rd
- 329 Longview Rd
- 317 Longview Rd
- 405 Longview Rd
- 2038 N Sheridan Rd
- 413 Longview Rd
- 311 Longview Rd
- 2036 N Sheridan Rd
- 2055 North Ave
- 2059 North Ave
- 2049 North Ave
- 2047 North Ave
- 2041 North Ave
- 2031 North Ave
- 2035 North Ave
- 2026 N Sheridan Rd
- 2025 North Ave
- 2014 N Sheridan Rd
- 2044 North Ave
- 2021 North Ave