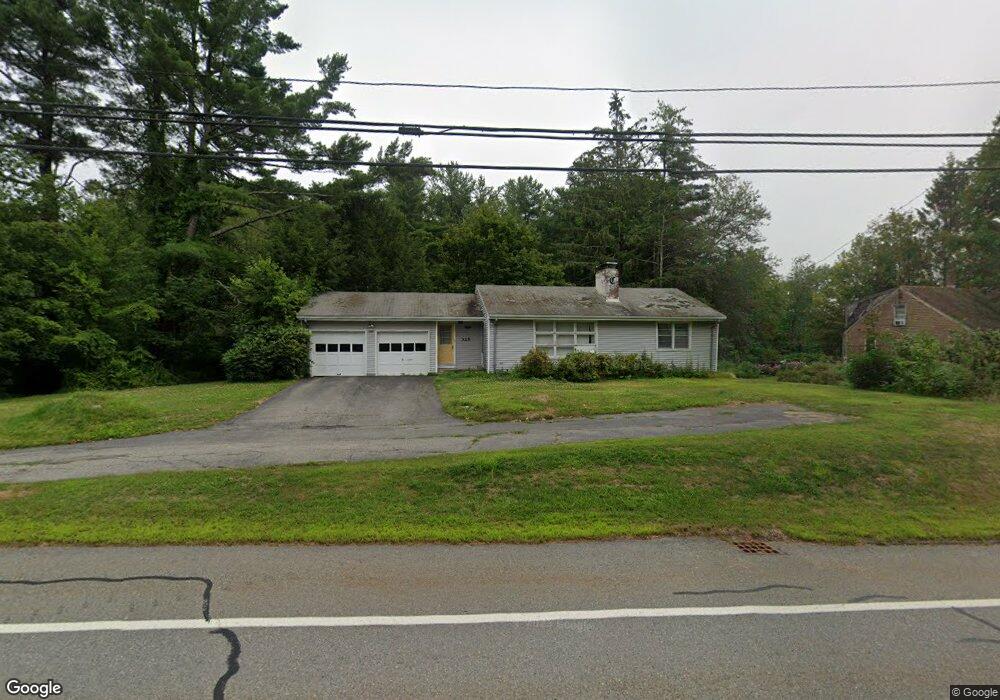
325 Main St Rutland, MA 01543
Estimated Value: $336,000 - $397,000
2
Beds
1
Bath
1,080
Sq Ft
$349/Sq Ft
Est. Value
About This Home
This home is located at 325 Main St, Rutland, MA 01543 and is currently estimated at $377,448, approximately $349 per square foot. 325 Main St is a home located in Worcester County with nearby schools including Wachusett Regional High School.
Ownership History
Date
Name
Owned For
Owner Type
Purchase Details
Closed on
Dec 29, 2017
Sold by
Crum Joseph S
Bought by
Omalley Jason
Current Estimated Value
Home Financials for this Owner
Home Financials are based on the most recent Mortgage that was taken out on this home.
Original Mortgage
$184,300
Outstanding Balance
$155,567
Interest Rate
3.95%
Mortgage Type
New Conventional
Estimated Equity
$221,881
Purchase Details
Closed on
Oct 30, 2002
Sold by
Currier Lorelle S Est
Bought by
Crum Joseph S
Home Financials for this Owner
Home Financials are based on the most recent Mortgage that was taken out on this home.
Original Mortgage
$128,000
Interest Rate
6.09%
Mortgage Type
Purchase Money Mortgage
Create a Home Valuation Report for This Property
The Home Valuation Report is an in-depth analysis detailing your home's value as well as a comparison with similar homes in the area
Home Values in the Area
Average Home Value in this Area
Purchase History
| Date | Buyer | Sale Price | Title Company |
|---|---|---|---|
| Omalley Jason | $190,000 | -- | |
| Crum Joseph S | $160,000 | -- |
Source: Public Records
Mortgage History
| Date | Status | Borrower | Loan Amount |
|---|---|---|---|
| Open | Omalley Jason | $184,300 | |
| Previous Owner | Crum Joseph S | $128,000 |
Source: Public Records
Tax History Compared to Growth
Tax History
| Year | Tax Paid | Tax Assessment Tax Assessment Total Assessment is a certain percentage of the fair market value that is determined by local assessors to be the total taxable value of land and additions on the property. | Land | Improvement |
|---|---|---|---|---|
| 2025 | $4,171 | $292,900 | $85,300 | $207,600 |
| 2024 | $3,991 | $269,100 | $81,500 | $187,600 |
| 2023 | $3,706 | $270,100 | $76,800 | $193,300 |
| 2022 | $3,589 | $227,300 | $64,900 | $162,400 |
| 2021 | $3,398 | $203,500 | $64,900 | $138,600 |
| 2020 | $3,555 | $201,900 | $61,400 | $140,500 |
| 2019 | $3,481 | $194,600 | $58,500 | $136,100 |
| 2018 | $3,365 | $185,600 | $58,500 | $127,100 |
| 2017 | $3,305 | $180,400 | $58,500 | $121,900 |
| 2016 | $3,029 | $174,400 | $59,100 | $115,300 |
| 2015 | $2,845 | $161,200 | $59,100 | $102,100 |
| 2014 | $2,758 | $161,200 | $59,100 | $102,100 |
Source: Public Records
Map
Nearby Homes
- 10 Soucy Dr
- Lot 24R Quail Run
- Lot 29 Quail Run
- Lot 27A Quail Run
- 4 Fidelity Dr Unit 2
- 6 Fidelity Dr Unit 3
- 28 Forest Hill Dr
- 12 Fidelity Dr Unit 6
- 10 Fidelity Dr Unit 5
- 32 Pommogussett Rd Unit 1
- 132 Fidelity Dr Unit 61
- 5 Miles Rd
- 47 Woodside Ave
- 2 Forest Hill Dr
- 6 Lewis St
- 51 Woodside Ave
- 12 Lewis St
- 11 Lewis St
- 21 Lewis St
- 27 Lewis St