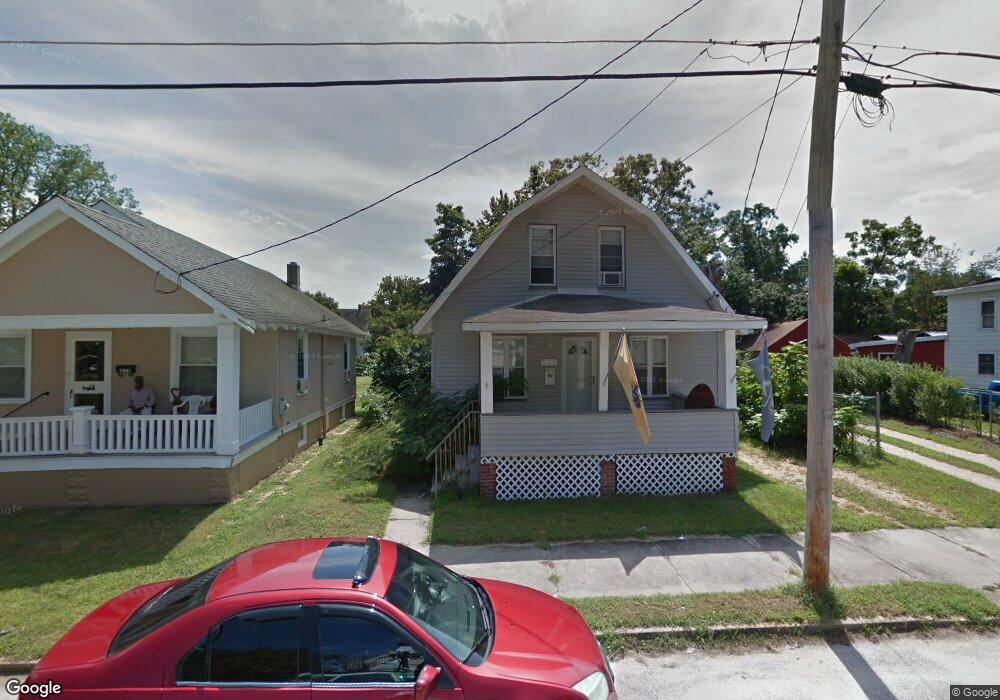
325 Maurice St Millville, NJ 08332
Estimated Value: $196,840
2
Beds
1
Bath
576
Sq Ft
$342/Sq Ft
Est. Value
About This Home
This home is located at 325 Maurice St, Millville, NJ 08332 and is currently priced at $196,840, approximately $341 per square foot. 325 Maurice St is a home located in Cumberland County with nearby schools including Silver Run Elementary School, Lakeside Middle School, and Memorial High School.
Ownership History
Date
Name
Owned For
Owner Type
Purchase Details
Closed on
May 25, 2000
Sold by
Jost Michael C
Bought by
Hoffman Melanie J
Current Estimated Value
Home Financials for this Owner
Home Financials are based on the most recent Mortgage that was taken out on this home.
Original Mortgage
$60,967
Outstanding Balance
$21,002
Interest Rate
8.1%
Mortgage Type
FHA
Purchase Details
Closed on
Feb 18, 1997
Sold by
Mcmahon Virginia
Bought by
Jost Michael C
Create a Home Valuation Report for This Property
The Home Valuation Report is an in-depth analysis detailing your home's value as well as a comparison with similar homes in the area
Home Values in the Area
Average Home Value in this Area
Purchase History
| Date | Buyer | Sale Price | Title Company |
|---|---|---|---|
| Hoffman Melanie J | $61,000 | -- | |
| Jost Michael C | $17,251 | -- |
Source: Public Records
Mortgage History
| Date | Status | Borrower | Loan Amount |
|---|---|---|---|
| Open | Hoffman Melanie J | $60,967 |
Source: Public Records
Tax History Compared to Growth
Tax History
| Year | Tax Paid | Tax Assessment Tax Assessment Total Assessment is a certain percentage of the fair market value that is determined by local assessors to be the total taxable value of land and additions on the property. | Land | Improvement |
|---|---|---|---|---|
| 2025 | -- | $64,700 | $14,300 | $50,400 |
| 2024 | -- | $64,700 | $14,300 | $50,400 |
| 2023 | -- | $64,700 | $14,300 | $50,400 |
| 2022 | $0 | $64,700 | $14,300 | $50,400 |
| 2021 | $1,976 | $64,700 | $14,300 | $50,400 |
| 2020 | $1,976 | $64,700 | $14,300 | $50,400 |
| 2019 | $1,976 | $64,700 | $14,300 | $50,400 |
| 2018 | $2,180 | $64,700 | $14,300 | $50,400 |
| 2017 | $2,160 | $64,700 | $14,300 | $50,400 |
| 2016 | $2,133 | $64,700 | $14,300 | $50,400 |
| 2015 | $2,085 | $64,700 | $14,300 | $50,400 |
| 2014 | $2,089 | $64,700 | $14,300 | $50,400 |
Source: Public Records
Map
Nearby Homes