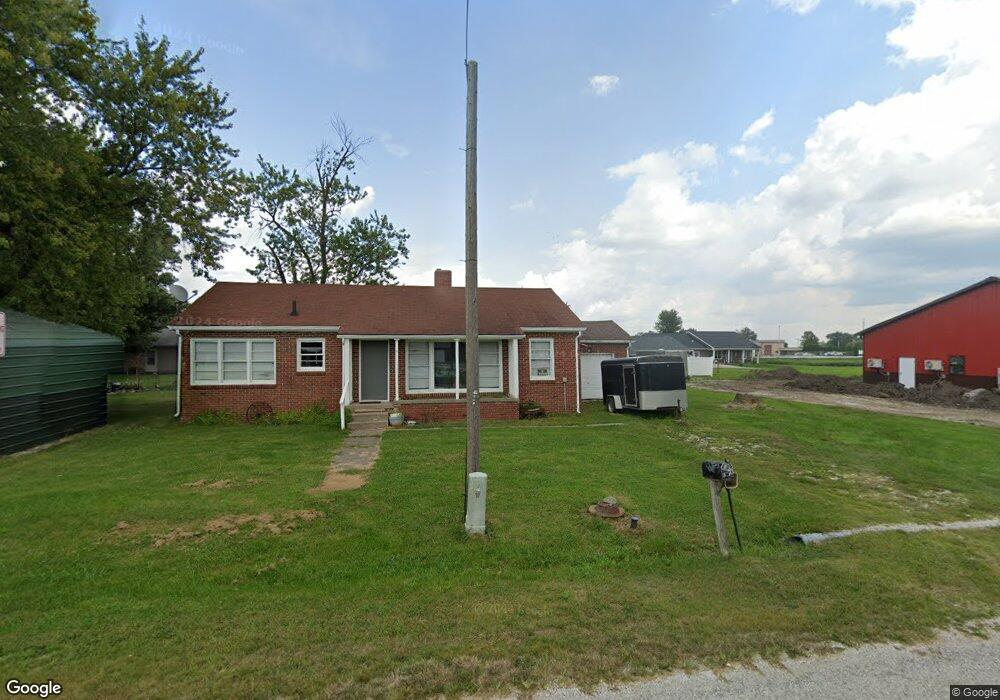
325 N Griffin Way St Carthage, IL 62321
Estimated Value: $130,000 - $151,000
--
Bed
--
Bath
--
Sq Ft
0.27
Acres
About This Home
This home is located at 325 N Griffin Way St, Carthage, IL 62321 and is currently estimated at $143,333. 325 N Griffin Way St is a home located in Hancock County with nearby schools including Illini West High School.
Ownership History
Date
Name
Owned For
Owner Type
Purchase Details
Closed on
Sep 16, 2025
Sold by
Housewright Jeremy and Housewright Alison
Bought by
Lincoln 6 Llc
Current Estimated Value
Home Financials for this Owner
Home Financials are based on the most recent Mortgage that was taken out on this home.
Original Mortgage
$203,000
Outstanding Balance
$203,000
Interest Rate
6.63%
Mortgage Type
New Conventional
Estimated Equity
-$59,667
Purchase Details
Closed on
Aug 1, 2022
Bought by
Housewright Jeremy A and Housewright Alison N
Create a Home Valuation Report for This Property
The Home Valuation Report is an in-depth analysis detailing your home's value as well as a comparison with similar homes in the area
Home Values in the Area
Average Home Value in this Area
Purchase History
| Date | Buyer | Sale Price | Title Company |
|---|---|---|---|
| Lincoln 6 Llc | $254,000 | None Listed On Document | |
| Housewright Jeremy A | $110,000 | -- |
Source: Public Records
Mortgage History
| Date | Status | Borrower | Loan Amount |
|---|---|---|---|
| Open | Lincoln 6 Llc | $203,000 |
Source: Public Records
Tax History Compared to Growth
Tax History
| Year | Tax Paid | Tax Assessment Tax Assessment Total Assessment is a certain percentage of the fair market value that is determined by local assessors to be the total taxable value of land and additions on the property. | Land | Improvement |
|---|---|---|---|---|
| 2024 | $3,569 | $41,180 | $1,871 | $39,309 |
| 2023 | $3,569 | $38,389 | $1,744 | $36,645 |
| 2022 | $3,287 | $35,854 | $1,629 | $34,225 |
| 2021 | $2,967 | $33,937 | $1,604 | $32,333 |
| 2020 | $2,792 | $31,732 | $1,500 | $30,232 |
| 2019 | $2,833 | $32,380 | $1,531 | $30,849 |
| 2018 | $2,889 | $33,451 | $1,582 | $31,869 |
| 2017 | $3,571 | $40,056 | $1,582 | $38,474 |
| 2015 | $2,825 | $37,893 | $1,496 | $36,397 |
| 2014 | $2,825 | $32,491 | $1,405 | $31,086 |
| 2012 | $2,825 | $32,052 | $1,386 | $30,666 |
Source: Public Records
Map
Nearby Homes
- 719 Questover Dr
- 724 Questover Dr
- 723 Questover Dr
- 720 Questover Dr
- 728 Questover Dr
- 721 Questover Dr
- 717 Questover Dr
- 725 Questover Dr
- 716 Questover Dr
- 727 Questover Dr
- 710 N Haven Dr
- 712 N Haven Dr
- 714 N Haven Dr
- 712 Questover Dr
- 729 Questover Dr
- 708 N Haven Dr
- 722 Questover Dr
- 718 Questover Dr
- 730 N Haven Dr
- 713 N Haven Dr