Estimated Value: $69,000 - $136,000
2
Beds
1
Bath
720
Sq Ft
$139/Sq Ft
Est. Value
About This Home
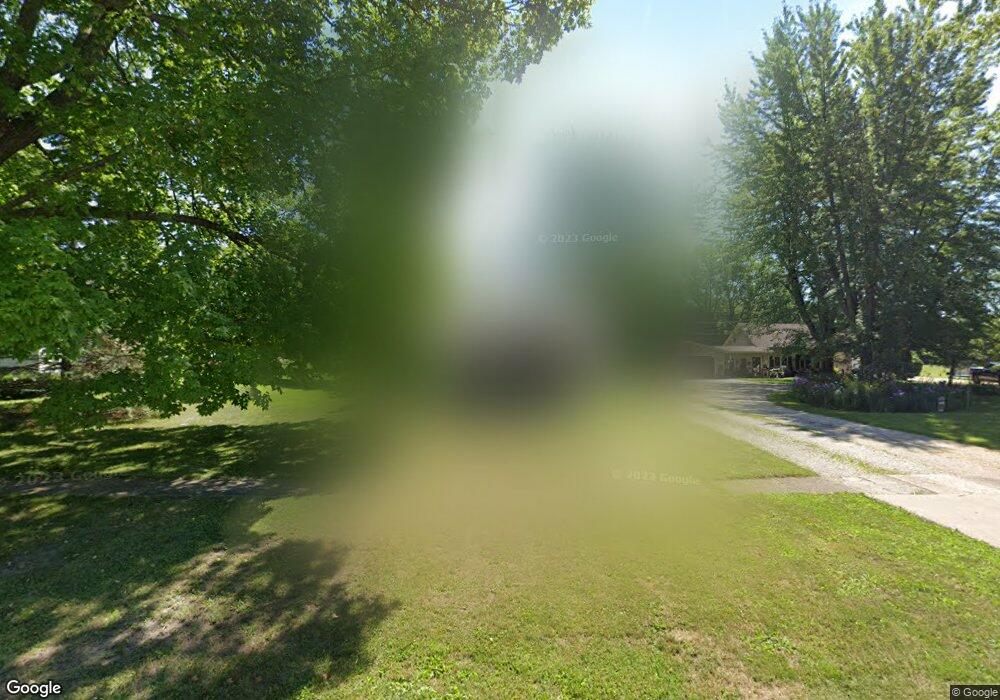
This home is located at 325 N Jefferson Ave, Amboy, IL 61310 and is currently estimated at $99,848, approximately $138 per square foot. 325 N Jefferson Ave is a home located in Lee County with nearby schools including Amboy Central Elementary School, Amboy Junior High School, and Amboy High School.
Ownership History
Date
Name
Owned For
Owner Type
Purchase Details
Closed on
Mar 26, 2021
Sold by
Morrison Dale and Morrison Anna
Bought by
Marsh Timothy
Current Estimated Value
Home Financials for this Owner
Home Financials are based on the most recent Mortgage that was taken out on this home.
Original Mortgage
$49,600
Outstanding Balance
$44,711
Interest Rate
2.9%
Mortgage Type
New Conventional
Estimated Equity
$55,137
Purchase Details
Closed on
Jul 11, 2011
Sold by
Cook Breann E
Bought by
Bennett Joanne M
Home Financials for this Owner
Home Financials are based on the most recent Mortgage that was taken out on this home.
Original Mortgage
$65,000
Interest Rate
4.52%
Mortgage Type
New Conventional
Purchase Details
Closed on
Aug 27, 2007
Sold by
Noble Gregory T
Bought by
Cook Breann E
Home Financials for this Owner
Home Financials are based on the most recent Mortgage that was taken out on this home.
Original Mortgage
$69,000
Interest Rate
6.77%
Mortgage Type
New Conventional
Create a Home Valuation Report for This Property
The Home Valuation Report is an in-depth analysis detailing your home's value as well as a comparison with similar homes in the area
Home Values in the Area
Average Home Value in this Area
Purchase History
| Date | Buyer | Sale Price | Title Company |
|---|---|---|---|
| Marsh Timothy | $62,000 | None Available | |
| Bennett Joanne M | $332,000 | None Available | |
| Cook Breann E | $69,000 | None Available |
Source: Public Records
Mortgage History
| Date | Status | Borrower | Loan Amount |
|---|---|---|---|
| Open | Marsh Timothy | $49,600 | |
| Previous Owner | Bennett Joanne M | $65,000 | |
| Previous Owner | Cook Breann E | $69,000 |
Source: Public Records
Tax History Compared to Growth
Tax History
| Year | Tax Paid | Tax Assessment Tax Assessment Total Assessment is a certain percentage of the fair market value that is determined by local assessors to be the total taxable value of land and additions on the property. | Land | Improvement |
|---|---|---|---|---|
| 2024 | $1,283 | $21,016 | $3,396 | $17,620 |
| 2023 | $1,104 | $18,275 | $2,953 | $15,322 |
| 2022 | $1,001 | $16,766 | $2,709 | $14,057 |
| 2021 | $1,591 | $17,031 | $2,600 | $14,431 |
| 2020 | $1,575 | $16,535 | $2,524 | $14,011 |
| 2019 | $1,583 | $16,053 | $2,450 | $13,603 |
| 2018 | $1,528 | $15,288 | $2,333 | $12,955 |
| 2017 | $1,512 | $16,625 | $2,333 | $14,292 |
| 2016 | $1,502 | $16,625 | $2,333 | $14,292 |
| 2015 | $1,494 | $16,625 | $2,333 | $14,292 |
| 2014 | $1,610 | $16,625 | $2,333 | $14,292 |
| 2013 | $79 | $19,517 | $2,909 | $16,608 |
Source: Public Records
Map
Nearby Homes
- 300 E Division St
- 133 N East Ave
- 390 N East Ave
- 16 W Wasson Rd Unit 19
- 16 W Wasson Rd
- 1 E Main St
- 227 W Provost St
- 25 W Main St
- 1713 Nauman Rd
- 1061 Robbins Rd
- 1801 Lee Center Rd
- 1306 Whitney Rd
- 9/46 Woodhaven Dr
- 8/110 Woodhaven Dr
- 1/136&137 Woodhaven Dr
- 4/2 Woodhaven Dr
- 16/158 Woodhaven Dr
- 2/292 Woodhaven Dr
- 21/211 Woodhaven Dr
- 17/100 Woodhaven Dr
- 321 N Jefferson Ave
- 337 N Jefferson Ave
- 311 N Jefferson Ave
- 339 N Jefferson Ave
- 343 N Jefferson Ave
- 322 N Jefferson Ave
- 318 N Jefferson Ave
- 326 N Jefferson Ave
- 305 N Jefferson Ave
- 314 N Jefferson Ave
- 332 N Jefferson Ave
- 304 N Jefferson Ave
- 304 N Jefferson Ave Unit 302
- 333 E Wasson Rd
- 245 N Jefferson Ave
- 325 N Mason Ave
- 323 N Mason Ave
- 313 N Mason Ave
- 337 N Mason Ave
- 311 N Mason Ave