2
Seller's Agent in 2019
240 Broker240
Coldwell Banker Commercial Dev

Estimated Value: $781,065
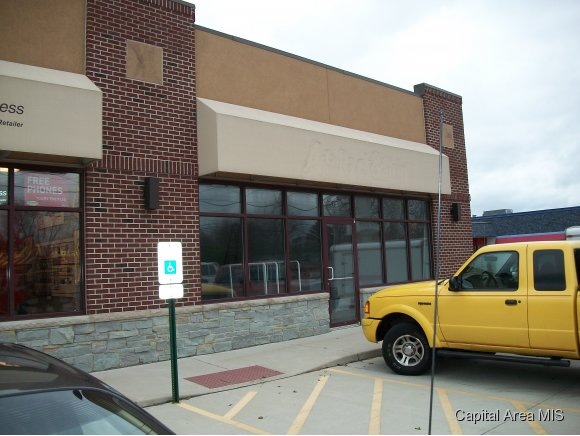
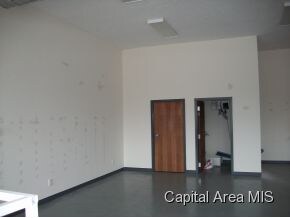
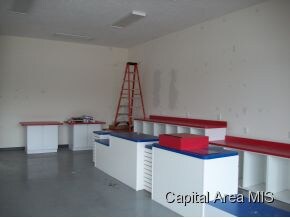
Many uses for this highly visible retail space. Co-tenants are Verizon and Secret Recipes. Also located in the area are McDonalds, Hardees, Subway and several banks. 17,000 CPD traffic count. Radiant floor heat, very reasonable heating bills.Suggested uses: bank, insurance agent, package liquor, pack-n-ship, medical/professional offices.
Last Agent to Sell the Property
240 Broker240
Coldwell Banker Commercial Dev Listed on: 01/01/2012
| Date | Buyer | Sale Price | Title Company |
|---|---|---|---|
| Ficus Tree Partners Michigan Llc | $610,000 | Gates Wise Schlosser & Goebel | |
| -- | -- | -- | |
| -- | $174,000 | -- |
| Date | Status | Borrower | Loan Amount |
|---|---|---|---|
| Open | Ficus Tree Partners Michigan Llc | $610,000 |
| Date | Event | Price | List to Sale | Price per Sq Ft | Prior Sale |
|---|---|---|---|---|---|
| 02/01/2019 02/01/19 | Sold | -- | -- | -- | |
| 01/02/2019 01/02/19 | Pending | -- | -- | -- | |
| 07/19/2018 07/19/18 | Sold | -- | -- | -- | View Prior Sale |
| 06/19/2018 06/19/18 | Pending | -- | -- | -- | |
| 10/09/2017 10/09/17 | For Sale | -- | -- | -- | |
| 01/01/2012 01/01/12 | For Sale | -- | -- | -- |
| Year | Tax Paid | Tax Assessment Tax Assessment Total Assessment is a certain percentage of the fair market value that is determined by local assessors to be the total taxable value of land and additions on the property. | Land | Improvement |
|---|---|---|---|---|
| 2024 | $17,268 | $240,784 | $80,641 | $160,143 |
| 2023 | $16,640 | $221,594 | $74,214 | $147,380 |
| 2022 | $16,381 | $213,420 | $71,476 | $141,944 |
| 2021 | $16,237 | $209,852 | $70,281 | $139,571 |
| 2020 | $15,842 | $204,734 | $68,567 | $136,167 |
| 2019 | $15,589 | $204,489 | $68,485 | $136,004 |
| 2018 | $15,189 | $202,085 | $67,680 | $134,405 |
| 2017 | $15,027 | $199,887 | $66,944 | $132,943 |
| 2016 | $14,785 | $195,757 | $65,561 | $130,196 |
| 2015 | $14,881 | $193,857 | $64,925 | $128,932 |
| 2014 | $14,817 | $191,653 | $64,187 | $127,466 |
| 2013 | $14,546 | $188,709 | $63,201 | $125,508 |
2
Seller's Agent in 2019
240 Broker240
Coldwell Banker Commercial Dev
D
Seller's Agent in 2018
Denise Bean-Mathis
IN BETWEEN OFFICES
Source: RMLS Alliance
MLS Number: RMACA120011
APN: 28-12.0-278-028
Disclaimer: Certain information contained herein is derived from information provided by parties other than Homes.com. All information provided is deemed reliable, but is not guaranteed to be accurate and should be independently verified.
![]() Based on information submitted to the MLS GRID. All data is obtained from various sources and may not have been verified by broker or MLS GRID. Supplied Open House Information is subject to change without notice. All information should be independently reviewed and verified for accuracy. Properties may or may not be listed by the office/agent presenting the information. Some IDX listings have been excluded from this website.IDX information is provided exclusively for personal, non-commercial use, and may not be used for any purpose other than to identify prospective properties consumers may be interested in purchasing. Information is deemed reliable but not guaranteed.
Based on information submitted to the MLS GRID. All data is obtained from various sources and may not have been verified by broker or MLS GRID. Supplied Open House Information is subject to change without notice. All information should be independently reviewed and verified for accuracy. Properties may or may not be listed by the office/agent presenting the information. Some IDX listings have been excluded from this website.IDX information is provided exclusively for personal, non-commercial use, and may not be used for any purpose other than to identify prospective properties consumers may be interested in purchasing. Information is deemed reliable but not guaranteed.
Based on information submitted to the MLS GRID
Ask me questions while you tour the home.
