325 N Main St Fillmore, UT 84631
Estimated Value: $284,000 - $340,000
3
Beds
2
Baths
2,072
Sq Ft
$149/Sq Ft
Est. Value
About This Home
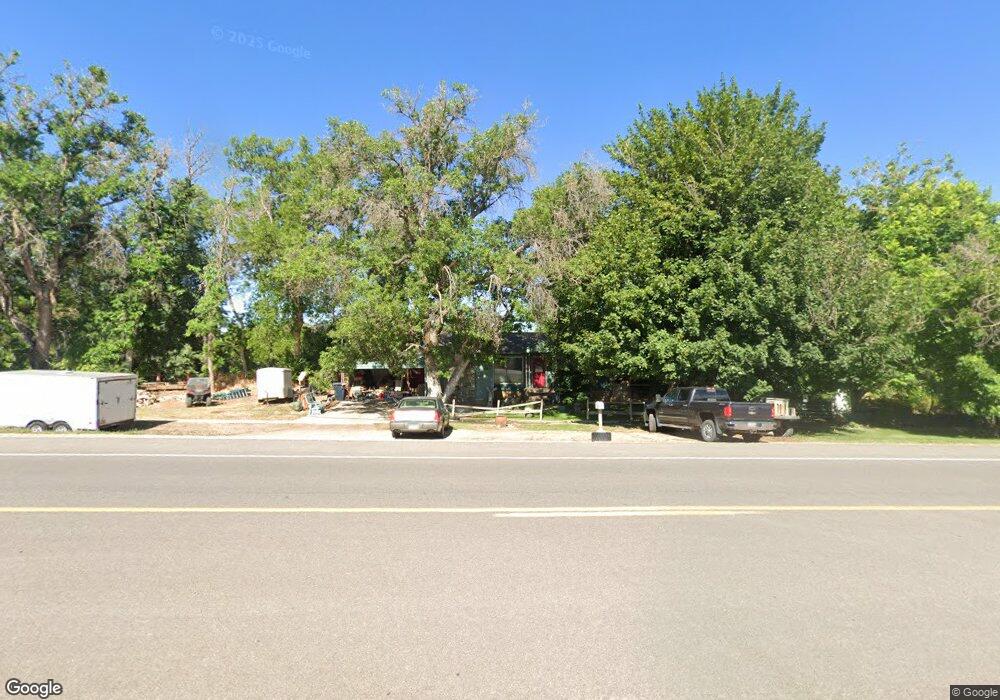
This home is located at 325 N Main St, Fillmore, UT 84631 and is currently estimated at $308,823, approximately $149 per square foot. 325 N Main St is a home located in Millard County.
Ownership History
Date
Name
Owned For
Owner Type
Purchase Details
Closed on
Apr 13, 2020
Sold by
Paxton Aaron and Marshall Melissa
Bought by
Paxton Aaron V and Marshall Melissa J
Current Estimated Value
Purchase Details
Closed on
Aug 9, 2011
Sold by
Scottorn Thomas K
Bought by
Paxton Aaron and Marshall Melissa
Create a Home Valuation Report for This Property
The Home Valuation Report is an in-depth analysis detailing your home's value as well as a comparison with similar homes in the area
Home Values in the Area
Average Home Value in this Area
Purchase History
| Date | Buyer | Sale Price | Title Company |
|---|---|---|---|
| Paxton Aaron V | -- | None Available | |
| Paxton Aaron | -- | -- |
Source: Public Records
Tax History Compared to Growth
Tax History
| Year | Tax Paid | Tax Assessment Tax Assessment Total Assessment is a certain percentage of the fair market value that is determined by local assessors to be the total taxable value of land and additions on the property. | Land | Improvement |
|---|---|---|---|---|
| 2025 | $1,081 | $135,831 | $22,046 | $113,785 |
| 2024 | $1,081 | $121,311 | $18,448 | $102,863 |
| 2023 | $1,227 | $121,311 | $18,448 | $102,863 |
| 2022 | $945 | $84,823 | $18,448 | $66,375 |
| 2021 | $817 | $70,452 | $11,979 | $58,473 |
| 2020 | $756 | $65,569 | $10,890 | $54,679 |
| 2019 | $649 | $56,423 | $10,890 | $45,533 |
| 2018 | $619 | $55,139 | $10,890 | $44,249 |
| 2017 | $562 | $47,547 | $10,890 | $36,657 |
| 2016 | $537 | $47,547 | $10,890 | $36,657 |
| 2015 | $538 | $47,547 | $10,890 | $36,657 |
| 2014 | -- | $47,547 | $10,890 | $36,657 |
| 2013 | -- | $47,547 | $10,890 | $36,657 |
Source: Public Records
Map
Nearby Homes
- 390 N 100 W
- 295 N 100 West St
- 380 N 200 St W
- 165 N 100 W
- 225 W 200 St N
- 75 N 100 West St
- 335 W 400 North St
- 40 S 100 Rd E
- 120 S 100 East Rd
- 220 S 200 E
- 410 W 400 N
- 430 E Canyon Rd
- 190 W 400 St S
- 310 S 500 West Rd
- 310 S 600 E
- 155 E 500 St S
- 157 E 500 South St
- 2155 N Cedar Mountain Rd
- 2835 N Cedar Mountain Rd
- 405 E 500 St S