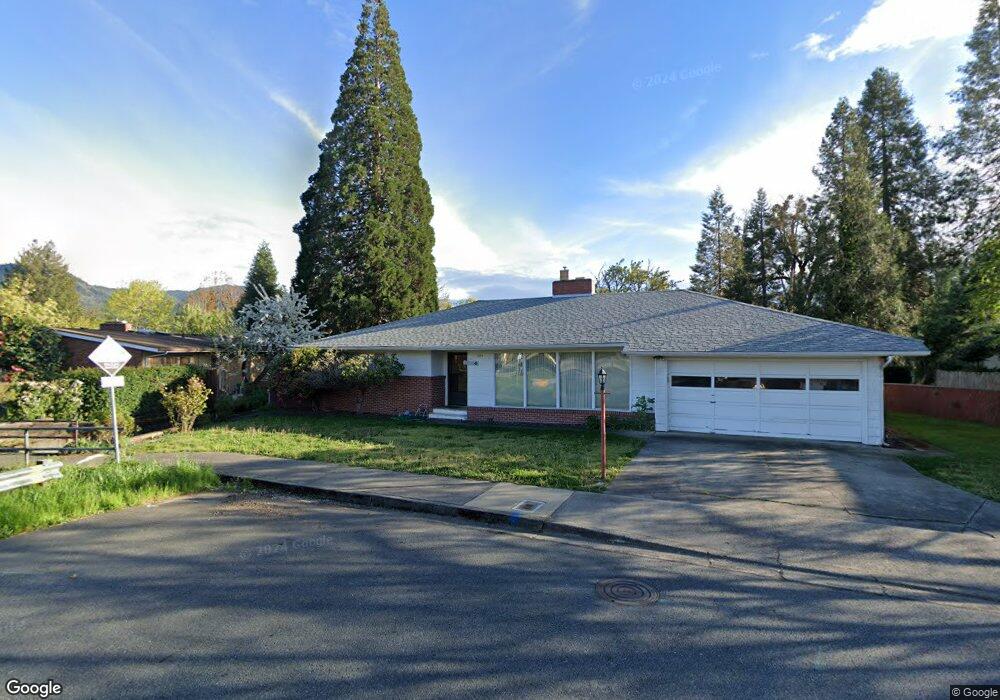
325 NE C St Grants Pass, OR 97526
Estimated Value: $388,741 - $394,000
2
Beds
2
Baths
1,678
Sq Ft
$233/Sq Ft
Est. Value
About This Home
This home is located at 325 NE C St, Grants Pass, OR 97526 and is currently estimated at $391,371, approximately $233 per square foot. 325 NE C St is a home located in Josephine County with nearby schools including Lincoln Elementary School, North Middle School, and Grants Pass High School.
Ownership History
Date
Name
Owned For
Owner Type
Purchase Details
Closed on
Oct 20, 2011
Sold by
Wineteer Juna
Bought by
Bulyalert Siriluk
Current Estimated Value
Home Financials for this Owner
Home Financials are based on the most recent Mortgage that was taken out on this home.
Original Mortgage
$58,000
Interest Rate
4.06%
Mortgage Type
Purchase Money Mortgage
Purchase Details
Closed on
Jul 22, 2009
Sold by
Orr Cindy
Bought by
Boothe Robert D
Create a Home Valuation Report for This Property
The Home Valuation Report is an in-depth analysis detailing your home's value as well as a comparison with similar homes in the area
Home Values in the Area
Average Home Value in this Area
Purchase History
| Date | Buyer | Sale Price | Title Company |
|---|---|---|---|
| Bulyalert Siriluk | $64,000 | Fa | |
| Boothe Robert D | $160,000 | Ticor Title Company Oregon |
Source: Public Records
Mortgage History
| Date | Status | Borrower | Loan Amount |
|---|---|---|---|
| Closed | Bulyalert Siriluk | $58,000 |
Source: Public Records
Tax History Compared to Growth
Tax History
| Year | Tax Paid | Tax Assessment Tax Assessment Total Assessment is a certain percentage of the fair market value that is determined by local assessors to be the total taxable value of land and additions on the property. | Land | Improvement |
|---|---|---|---|---|
| 2025 | $2,878 | $221,580 | -- | -- |
| 2024 | $2,878 | $215,130 | -- | -- |
| 2023 | $2,710 | $208,870 | $0 | $0 |
| 2022 | $2,723 | $202,790 | -- | -- |
| 2021 | $2,558 | $196,890 | $0 | $0 |
| 2020 | $2,484 | $191,160 | $0 | $0 |
| 2019 | $2,412 | $185,600 | $0 | $0 |
| 2018 | $2,455 | $180,200 | $0 | $0 |
| 2017 | $2,436 | $174,960 | $0 | $0 |
| 2016 | $2,142 | $169,870 | $0 | $0 |
| 2015 | $2,072 | $164,930 | $0 | $0 |
| 2014 | $2,015 | $160,130 | $0 | $0 |
Source: Public Records
Map
Nearby Homes
- 811 NE Clyde Place
- 811 NE Clyde Place Unit 116 C
- 702 NE A St
- 715 NE A St
- 728 NW 6th St
- 807 NW 5th St
- 409 SE J St
- 415 SE J St
- 139 SW I St
- 751 NW 4th St
- 719 NW 3rd St
- 419 NW C St
- 419 NW D St
- 303 SW I St
- 702 SE 9th St
- 508 NW E St Unit A,B,C
- 425 NE Silverwood Place
- 414 SW I St
- 524 NW C St
- 431 NE Silverwood Place