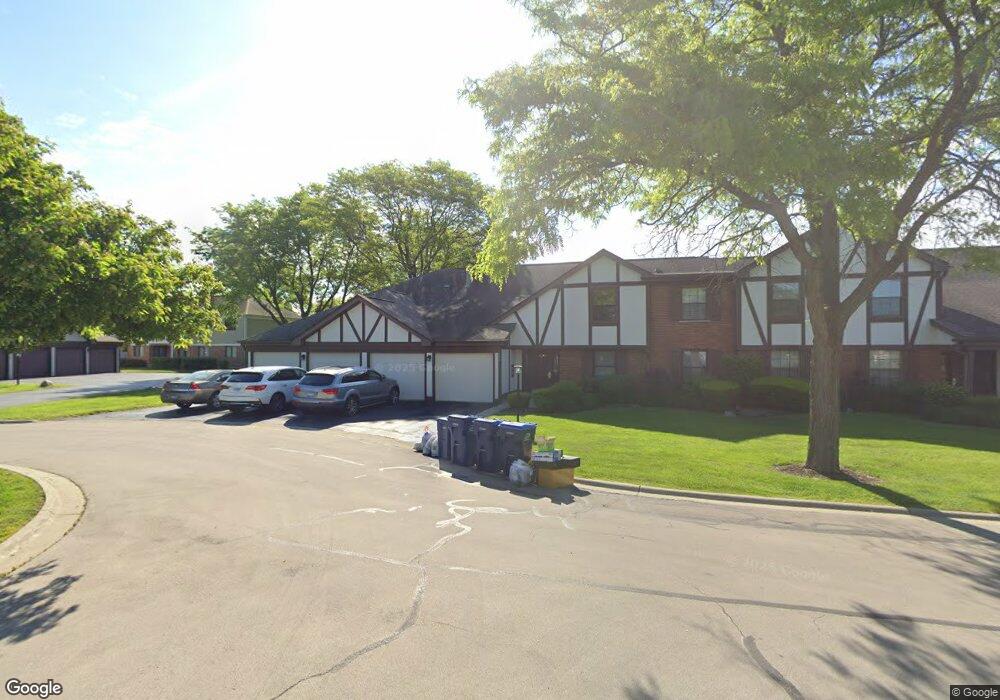
325 Oak Meadow Ct Unit 5588LA Schaumburg, IL 60193
East Schaumburg NeighborhoodEstimated Value: $253,000 - $302,000
3
Beds
--
Bath
1,500
Sq Ft
$187/Sq Ft
Est. Value
About This Home
This home is located at 325 Oak Meadow Ct Unit 5588LA, Schaumburg, IL 60193 and is currently estimated at $280,718, approximately $187 per square foot. 325 Oak Meadow Ct Unit 5588LA is a home located in Cook County with nearby schools including Michael Collins Elementary School, Margaret Mead Junior High School, and J B Conant High School.
Ownership History
Date
Name
Owned For
Owner Type
Purchase Details
Closed on
Jan 19, 2021
Sold by
Franable Leanard and Elizabeth M Tomabene Trust
Bought by
Cannova John
Current Estimated Value
Home Financials for this Owner
Home Financials are based on the most recent Mortgage that was taken out on this home.
Original Mortgage
$123,750
Interest Rate
3.12%
Mortgage Type
New Conventional
Purchase Details
Closed on
Feb 24, 2004
Sold by
Tornabene Elizabeth M
Bought by
Tornabene Elizabeth M and Elizabeth M Tornabene Trust
Purchase Details
Closed on
Dec 4, 2003
Sold by
Lieberman Rebecca
Bought by
Tornabene Elizabeth M
Purchase Details
Closed on
Nov 14, 2001
Sold by
Pifke Gloria A
Bought by
Lieberman Rebecca L
Home Financials for this Owner
Home Financials are based on the most recent Mortgage that was taken out on this home.
Original Mortgage
$148,000
Interest Rate
6.68%
Mortgage Type
FHA
Create a Home Valuation Report for This Property
The Home Valuation Report is an in-depth analysis detailing your home's value as well as a comparison with similar homes in the area
Home Values in the Area
Average Home Value in this Area
Purchase History
| Date | Buyer | Sale Price | Title Company |
|---|---|---|---|
| Cannova John | $165,000 | Chicago Title | |
| Tornabene Elizabeth M | -- | Ticor Title Insurance Compan | |
| Tornabene Elizabeth M | $198,500 | Rtc | |
| Lieberman Rebecca L | $155,000 | -- |
Source: Public Records
Mortgage History
| Date | Status | Borrower | Loan Amount |
|---|---|---|---|
| Previous Owner | Cannova John | $123,750 | |
| Previous Owner | Lieberman Rebecca L | $148,000 |
Source: Public Records
Tax History Compared to Growth
Tax History
| Year | Tax Paid | Tax Assessment Tax Assessment Total Assessment is a certain percentage of the fair market value that is determined by local assessors to be the total taxable value of land and additions on the property. | Land | Improvement |
|---|---|---|---|---|
| 2024 | $6,057 | $21,624 | $5,261 | $16,363 |
| 2023 | $5,874 | $21,624 | $5,261 | $16,363 |
| 2022 | $5,874 | $21,624 | $5,261 | $16,363 |
| 2021 | $5,277 | $17,412 | $6,740 | $10,672 |
| 2020 | $1,151 | $17,412 | $6,740 | $10,672 |
| 2019 | $1,145 | $19,358 | $6,740 | $12,618 |
| 2018 | $1,285 | $13,383 | $5,671 | $7,712 |
| 2017 | $1,242 | $13,383 | $5,671 | $7,712 |
| 2016 | $1,819 | $13,383 | $5,671 | $7,712 |
| 2015 | $2,070 | $11,442 | $4,931 | $6,511 |
| 2014 | $2,004 | $11,442 | $4,931 | $6,511 |
| 2013 | $1,999 | $11,442 | $4,931 | $6,511 |
Source: Public Records
Map
Nearby Homes
- 1251 Williamsburg Dr Unit D-1
- 274 Buckingham Ct Unit D2
- 368 Southbury Ct Unit D2
- 373 Southbury Ct Unit D-1
- 1264 Williamsburg Dr Unit D2
- 1221 Plum Tree Ct Unit 5481RD
- 1386 Scarboro Rd Unit 1102
- 1385 Scarboro Rd Unit 204
- 228 Arrowwood Ct Unit D1
- 152 Brookston Dr Unit C2
- 391 Thornhill Ct Unit B1
- 151 Brookston Dr Unit A2
- 1301 Timberwood Ct Unit D1
- 1257 Rosewood Ct Unit D1
- 375 Pinetree Ln Unit D-1
- 327 Wildberry Ct Unit D2
- 236 Deerpath Ct Unit 3333LA
- 101 Bar Harbour Rd Unit 6
- 1300 Woodside Ct Unit B1
- 402 Sandalwood Ln Unit C1
- 325 Oak Meadow Ct Unit 5588LB
- 325 Oak Meadow Ct Unit 5588LA
- 325 Oak Meadow Ct Unit 5588LB
- 325 Oak Meadow Ct Unit B2
- 325 Oak Meadow Ct Unit B1
- 327 Oak Meadow Ct Unit D2
- 327 Oak Meadow Ct Unit 5588RD
- 327 Oak Meadow Ct Unit 5588RC
- 327 Oak Meadow Ct Unit 5588RD
- 327 Oak Meadow Ct Unit 5588RC
- 327 Oak Meadow Ct Unit C-2
- 327 Oak Meadow Ct Unit C1
- 327 Oak Meadow Ct Unit D1
- 317 Oak Meadow Ct Unit 5587RC
- 317 Oak Meadow Ct Unit 5587RC
- 317 Oak Meadow Ct Unit 5587RD
- 317 Oak Meadow Ct Unit 5587RD
- 317 Oak Meadow Ct Unit D1
- 317 Oak Meadow Ct Unit C-2
- 317 Oak Meadow Ct Unit C1