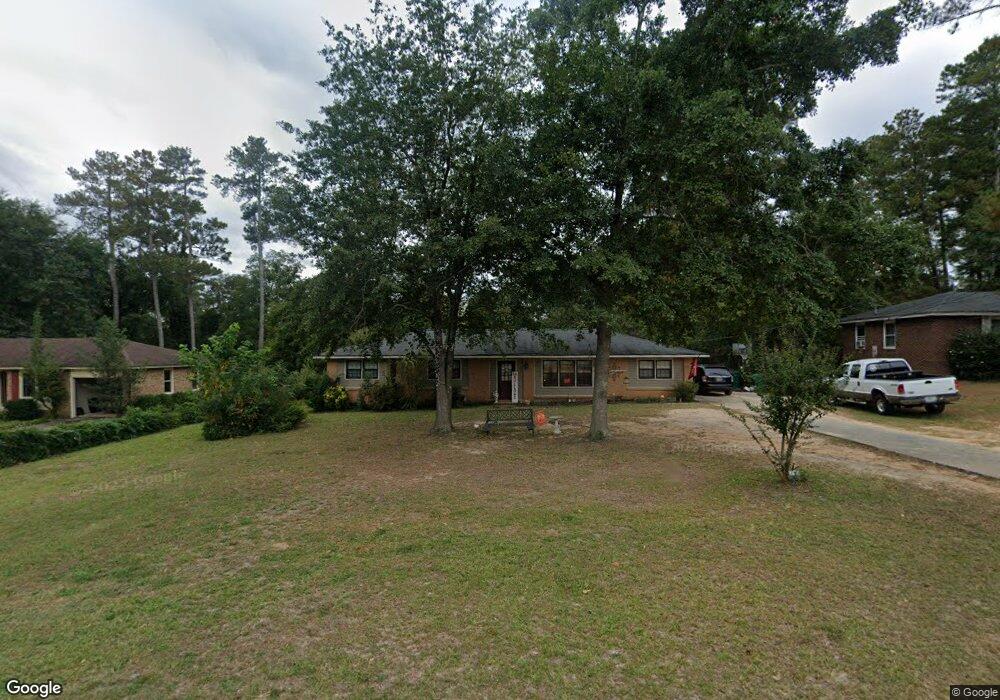
325 Padrick St Augusta, GA 30907
Estimated Value: $204,000 - $234,000
3
Beds
2
Baths
1,500
Sq Ft
$147/Sq Ft
Est. Value
About This Home
This home is located at 325 Padrick St, Augusta, GA 30907 and is currently estimated at $220,302, approximately $146 per square foot. 325 Padrick St is a home located in Columbia County with nearby schools including Northmore Elementary School, South Columbia Elementary School, and Roosevelt Middle School.
Ownership History
Date
Name
Owned For
Owner Type
Purchase Details
Closed on
Sep 2, 2020
Sold by
Ridenour Debra Black
Bought by
Ridenour Debra Black and Allsup Stephen F
Current Estimated Value
Home Financials for this Owner
Home Financials are based on the most recent Mortgage that was taken out on this home.
Original Mortgage
$15,000
Outstanding Balance
$11,943
Interest Rate
2.8%
Mortgage Type
New Conventional
Estimated Equity
$208,359
Purchase Details
Closed on
Aug 6, 2002
Sold by
Ridenour Edward
Bought by
Ridenour Debra Black
Purchase Details
Closed on
Dec 7, 2001
Sold by
Ridenour Debra B
Bought by
Ridenour Edward L and Ridenour Debra B
Home Financials for this Owner
Home Financials are based on the most recent Mortgage that was taken out on this home.
Original Mortgage
$74,700
Interest Rate
6.42%
Purchase Details
Closed on
Sep 13, 2001
Sold by
Davis Gerald W
Bought by
Ridenour Debra B
Create a Home Valuation Report for This Property
The Home Valuation Report is an in-depth analysis detailing your home's value as well as a comparison with similar homes in the area
Home Values in the Area
Average Home Value in this Area
Purchase History
| Date | Buyer | Sale Price | Title Company |
|---|---|---|---|
| Ridenour Debra Black | -- | -- | |
| Ridenour Debra Black | -- | -- | |
| Ridenour Edward L | -- | -- | |
| Ridenour Debra B | -- | -- |
Source: Public Records
Mortgage History
| Date | Status | Borrower | Loan Amount |
|---|---|---|---|
| Open | Ridenour Debra Black | $15,000 | |
| Previous Owner | Ridenour Edward L | $74,700 |
Source: Public Records
Tax History Compared to Growth
Tax History
| Year | Tax Paid | Tax Assessment Tax Assessment Total Assessment is a certain percentage of the fair market value that is determined by local assessors to be the total taxable value of land and additions on the property. | Land | Improvement |
|---|---|---|---|---|
| 2025 | $1,134 | $85,052 | $14,204 | $70,848 |
| 2024 | $1,022 | $78,504 | $13,604 | $64,900 |
| 2023 | $2,037 | $77,705 | $13,604 | $64,101 |
| 2022 | $1,773 | $65,981 | $13,204 | $52,777 |
| 2021 | $1,681 | $59,670 | $9,804 | $49,866 |
| 2020 | $1,621 | $56,253 | $9,804 | $46,449 |
| 2019 | $1,524 | $52,776 | $10,804 | $41,972 |
| 2018 | $1,217 | $41,544 | $7,604 | $33,940 |
| 2017 | $1,254 | $42,745 | $9,304 | $33,441 |
| 2016 | $1,193 | $42,062 | $9,680 | $32,382 |
| 2015 | $1,124 | $39,433 | $8,980 | $30,453 |
| 2014 | $1,142 | $39,584 | $6,880 | $32,704 |
Source: Public Records
Map
Nearby Homes
- 332 Mears St
- 352 Mears St
- 233 Anneswood Rd
- 241 Old Evans Rd
- 4074 Harden Ct
- 4080 Harden Ct
- 4015 Prescott Dr
- 0 Mc Cormick Rd
- 4007 Horseshoe Rd
- 4070 Riverwatch Pkwy
- 4106 Mansfield Place
- 3803 Murray Rd
- 4069 Riverwatch Pkwy
- 219 Stonington Dr
- 4063 Danielle Dr
- 3820 Murray Rd
- 539 Salterton Way
- 4045 Dowling Dr
- 507 Salterton Way
- 5553 Connor Dr