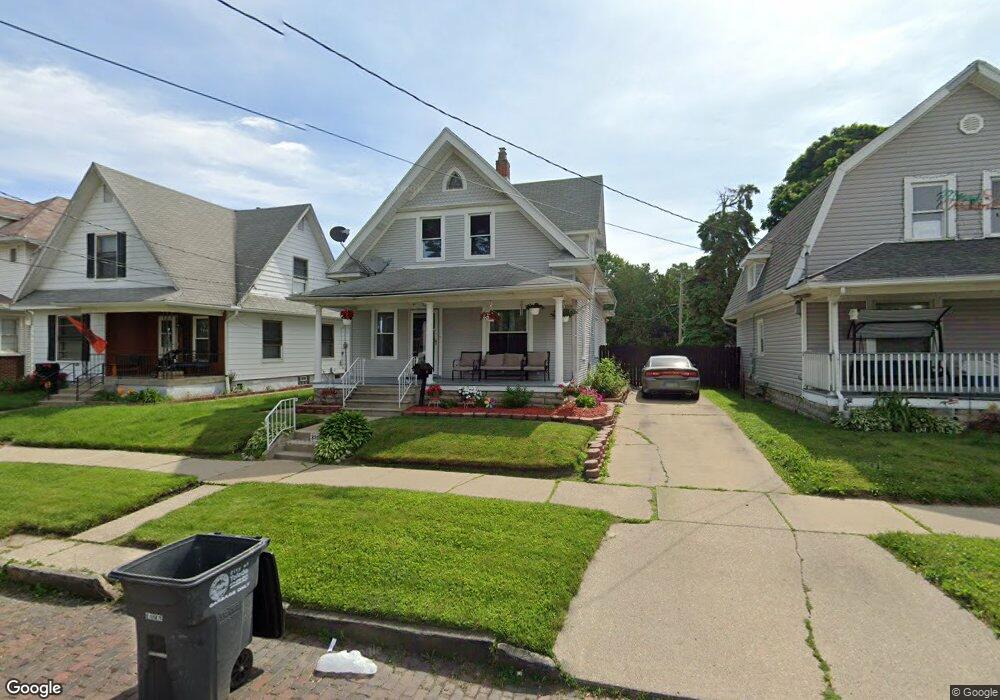
325 Plymouth St Toledo, OH 43605
East Toledo NeighborhoodEstimated Value: $86,000 - $97,000
3
Beds
1
Bath
1,603
Sq Ft
$57/Sq Ft
Est. Value
About This Home
This home is located at 325 Plymouth St, Toledo, OH 43605 and is currently estimated at $91,815, approximately $57 per square foot. 325 Plymouth St is a home located in Lucas County with nearby schools including Raymer Elementary School, Waite High School, and Kenmore Preparatory Academy dba Toledo Preparatory Academy.
Ownership History
Date
Name
Owned For
Owner Type
Purchase Details
Closed on
Dec 29, 2006
Sold by
Coraspe Arturo A and Coraspe Kathleen M
Bought by
Valdez Juan Acevedo and Acevedo Fabiola
Current Estimated Value
Home Financials for this Owner
Home Financials are based on the most recent Mortgage that was taken out on this home.
Original Mortgage
$76,632
Outstanding Balance
$45,948
Interest Rate
6.27%
Mortgage Type
FHA
Estimated Equity
$45,867
Purchase Details
Closed on
May 28, 1998
Sold by
Bochi Andrew W
Bought by
Coraspe Arturo A and Coraspe Kathleen M
Home Financials for this Owner
Home Financials are based on the most recent Mortgage that was taken out on this home.
Original Mortgage
$48,800
Interest Rate
7.27%
Purchase Details
Closed on
May 30, 1996
Sold by
Folk Michael D
Bought by
Boch Andrew W
Home Financials for this Owner
Home Financials are based on the most recent Mortgage that was taken out on this home.
Original Mortgage
$52,700
Interest Rate
7.99%
Mortgage Type
New Conventional
Purchase Details
Closed on
Jan 22, 1991
Sold by
Sommers Ii Robert E and Sommers #
Create a Home Valuation Report for This Property
The Home Valuation Report is an in-depth analysis detailing your home's value as well as a comparison with similar homes in the area
Home Values in the Area
Average Home Value in this Area
Purchase History
| Date | Buyer | Sale Price | Title Company |
|---|---|---|---|
| Valdez Juan Acevedo | $77,300 | First Capital Title Svcs Inc | |
| Coraspe Arturo A | $61,000 | -- | |
| Boch Andrew W | $55,500 | -- | |
| -- | $45,500 | -- |
Source: Public Records
Mortgage History
| Date | Status | Borrower | Loan Amount |
|---|---|---|---|
| Open | Valdez Juan Acevedo | $76,632 | |
| Closed | Coraspe Arturo A | $48,800 | |
| Closed | Boch Andrew W | $52,700 |
Source: Public Records
Tax History Compared to Growth
Tax History
| Year | Tax Paid | Tax Assessment Tax Assessment Total Assessment is a certain percentage of the fair market value that is determined by local assessors to be the total taxable value of land and additions on the property. | Land | Improvement |
|---|---|---|---|---|
| 2024 | $786 | $22,505 | $5,880 | $16,625 |
| 2023 | $1,446 | $19,670 | $5,285 | $14,385 |
| 2022 | $1,428 | $19,670 | $5,285 | $14,385 |
| 2021 | $1,421 | $19,670 | $5,285 | $14,385 |
| 2020 | $1,521 | $18,445 | $4,375 | $14,070 |
| 2019 | $1,482 | $18,445 | $4,375 | $14,070 |
| 2018 | $1,467 | $18,445 | $4,375 | $14,070 |
| 2017 | $1,536 | $18,025 | $4,270 | $13,755 |
| 2016 | $1,496 | $51,500 | $12,200 | $39,300 |
| 2015 | $1,445 | $51,500 | $12,200 | $39,300 |
| 2014 | $1,134 | $18,030 | $4,270 | $13,760 |
| 2013 | $1,134 | $18,030 | $4,270 | $13,760 |
Source: Public Records
Map
Nearby Homes
- 1326 Kelsey Ave
- 368 Plymouth St
- 332 Willard St
- 334 Willard St
- 1308 Starr Ave
- 349 Parker Ave
- 302 Parker Ave
- 1525 Kelsey Ave
- 218 White St
- 325 E Broadway St
- 291 E Broadway St
- 444 Raymer Blvd
- 457 Parker Ave
- 1702 Starr Ave
- 804 6th St
- 527 White St
- 1620 Denver Ave
- 421 Oswald St
- 1207 Nevada St
- 1421 N Ravine Pkwy