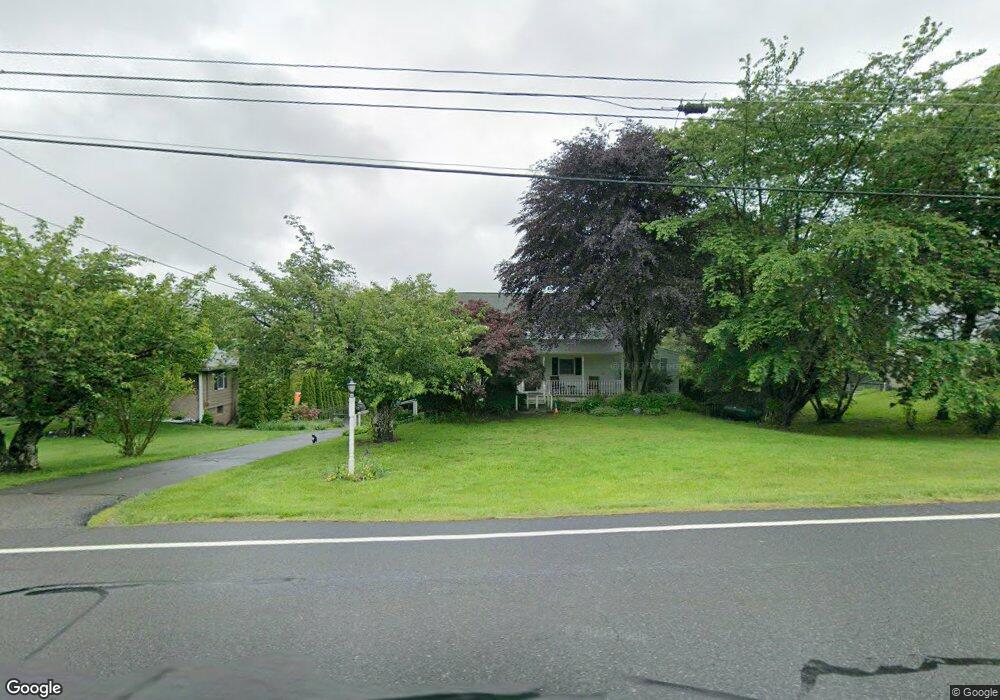
325 Ridge Rd Newton, NJ 07860
Estimated Value: $504,000 - $717,000
--
Bed
--
Bath
2,255
Sq Ft
$254/Sq Ft
Est. Value
About This Home
This home is located at 325 Ridge Rd, Newton, NJ 07860 and is currently estimated at $573,031, approximately $254 per square foot. 325 Ridge Rd is a home located in Sussex County with nearby schools including Fredon Township School, Kittatinny Regional High School, and Northwest Christian School.
Ownership History
Date
Name
Owned For
Owner Type
Purchase Details
Closed on
Nov 14, 2017
Sold by
Boland Thomas M and Boland Gene
Bought by
Aviles Jhonny and Herrera Esperanza
Current Estimated Value
Home Financials for this Owner
Home Financials are based on the most recent Mortgage that was taken out on this home.
Original Mortgage
$386,650
Outstanding Balance
$324,251
Interest Rate
3.88%
Mortgage Type
FHA
Estimated Equity
$248,780
Purchase Details
Closed on
Mar 21, 2001
Sold by
Hughes Edward R and Hughes Mildred P
Bought by
Boland Thomas M and Boland Suzanne
Home Financials for this Owner
Home Financials are based on the most recent Mortgage that was taken out on this home.
Original Mortgage
$175,000
Interest Rate
6.96%
Mortgage Type
Stand Alone First
Purchase Details
Closed on
Apr 15, 1996
Sold by
Graham Floyd W and Graham Evelyn D
Bought by
Hughes Edward R and Hughes Mildred P
Create a Home Valuation Report for This Property
The Home Valuation Report is an in-depth analysis detailing your home's value as well as a comparison with similar homes in the area
Home Values in the Area
Average Home Value in this Area
Purchase History
| Date | Buyer | Sale Price | Title Company |
|---|---|---|---|
| Aviles Jhonny | $415,000 | True North Title Svcs Llc | |
| Boland Thomas M | $220,000 | -- | |
| Hughes Edward R | $182,500 | -- |
Source: Public Records
Mortgage History
| Date | Status | Borrower | Loan Amount |
|---|---|---|---|
| Open | Aviles Jhonny | $386,650 | |
| Previous Owner | Boland Thomas M | $175,000 |
Source: Public Records
Tax History Compared to Growth
Tax History
| Year | Tax Paid | Tax Assessment Tax Assessment Total Assessment is a certain percentage of the fair market value that is determined by local assessors to be the total taxable value of land and additions on the property. | Land | Improvement |
|---|---|---|---|---|
| 2025 | $9,186 | $294,700 | $96,700 | $198,000 |
| 2024 | $8,797 | $294,700 | $96,700 | $198,000 |
| 2023 | $8,797 | $294,700 | $96,700 | $198,000 |
| 2022 | $8,620 | $294,700 | $96,700 | $198,000 |
| 2021 | $8,814 | $294,700 | $96,700 | $198,000 |
| 2020 | $8,767 | $294,700 | $96,700 | $198,000 |
| 2019 | $8,658 | $294,700 | $96,700 | $198,000 |
| 2018 | $8,511 | $294,700 | $96,700 | $198,000 |
| 2017 | $8,546 | $294,700 | $96,700 | $198,000 |
| 2016 | $8,470 | $294,700 | $96,700 | $198,000 |
| 2015 | $8,202 | $294,700 | $96,700 | $198,000 |
| 2014 | $8,063 | $294,700 | $96,700 | $198,000 |
Source: Public Records
Map
Nearby Homes
- 5 Babbitt Ct
- 219 Woodside Ave
- 21 Carriage Ln Unit 21
- 40 Carriage Ln Unit 40
- 76 Carriage Ln Unit 76
- 67 Ryerson Ave
- 41 Plainfield Ave
- 36 Paterson Ave
- 11 Betony Ct
- 103 Woodside Ave
- 0 W Nelson St
- 13 Summit Ave
- 37 Foster St
- 20 Anderson Hill Rd
- 66 Paterson Ave
- 9 Lawnwood Ave
- 5 Clarkson St
- 63 Merriam Ave
- 14 Trenton Place
- 208 Willows Rd