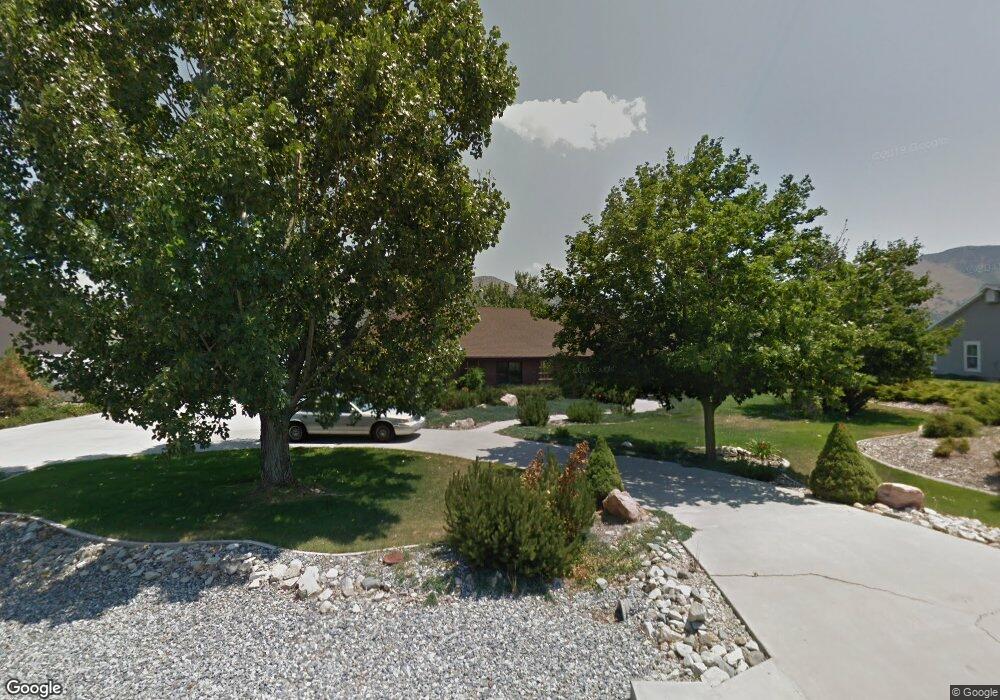
325 S 100 E Mantua, UT 84324
Estimated Value: $605,985 - $774,000
3
Beds
3
Baths
2,082
Sq Ft
$321/Sq Ft
Est. Value
About This Home
This home is located at 325 S 100 E, Mantua, UT 84324 and is currently estimated at $667,496, approximately $320 per square foot. 325 S 100 E is a home located in Box Elder County with nearby schools including Golden Spike Elementary, Box Elder Middle School, and Adele C. Young Intermediate School.
Ownership History
Date
Name
Owned For
Owner Type
Purchase Details
Closed on
Jul 26, 2022
Sold by
George Robert And Shirley Wagner Family
Bought by
Strong Kevin and Strong Lindsay
Current Estimated Value
Home Financials for this Owner
Home Financials are based on the most recent Mortgage that was taken out on this home.
Original Mortgage
$554,875
Outstanding Balance
$531,606
Interest Rate
5.78%
Mortgage Type
FHA
Estimated Equity
$135,890
Purchase Details
Closed on
Apr 16, 2014
Sold by
Christy Melanie Jean
Bought by
The George Robert And Shirley Wagner Fam
Purchase Details
Closed on
Feb 28, 2014
Sold by
Wagner Robert E and Wagner Shirley J
Bought by
Wagner Robert Ellis and Wagner Shirley Jean
Purchase Details
Closed on
May 31, 2007
Sold by
Wagner Robert E and Wagner Shirley J
Bought by
Wagner Robert E and Wagner Shirley J
Create a Home Valuation Report for This Property
The Home Valuation Report is an in-depth analysis detailing your home's value as well as a comparison with similar homes in the area
Purchase History
We collect this data history from publicly available records. To have your information removed, we recommend requesting removal directly through your county’s website.
| Date | Buyer | Sale Price | Title Company |
|---|---|---|---|
| Strong Kevin | -- | Cache Title | |
| The George Robert And Shirley Wagner Fam | -- | None Available | |
| Wagner Robert Ellis | -- | None Available | |
| Wagner Robert E | -- | None Available |
Source: Public Records
Mortgage History
We collect this data history from publicly available records. To have your information removed, we recommend requesting removal directly through your county’s website.
| Date | Status | Borrower | Loan Amount |
|---|---|---|---|
| Open | Strong Kevin | $554,875 |
Source: Public Records
Tax History
| Year | Tax Paid | Tax Assessment Tax Assessment Total Assessment is a certain percentage of the fair market value that is determined by local assessors to be the total taxable value of land and additions on the property. | Land | Improvement |
|---|---|---|---|---|
| 2025 | $3,436 | $575,223 | $202,400 | $372,823 |
| 2024 | $2,967 | $553,860 | $177,400 | $376,460 |
| 2023 | $3,203 | $615,386 | $177,400 | $437,986 |
| 2022 | $2,990 | $284,837 | $49,995 | $234,842 |
| 2021 | $2,846 | $405,730 | $90,900 | $314,830 |
| 2020 | $2,824 | $405,730 | $90,900 | $314,830 |
| 2019 | $2,672 | $203,231 | $49,995 | $153,236 |
| 2018 | $2,104 | $151,534 | $44,000 | $107,534 |
| 2017 | $2,166 | $275,516 | $44,000 | $195,516 |
| 2016 | $2,087 | $142,022 | $27,764 | $114,258 |
| 2015 | $1,897 | $131,635 | $27,764 | $103,871 |
| 2014 | $1,897 | $126,689 | $27,764 | $98,925 |
| 2013 | -- | $116,800 | $17,875 | $98,925 |
Source: Public Records
Map
Nearby Homes
- 263 E Fish Hatchery Rd
- 56 S Main St
- 1623 Willard Peak Rd Unit 1
- 1705 Willard Peak Rd Unit 2
- 534 E Fish Hatchery Rd
- 214 W Center St
- 91 U S 89
- 951 N Main St
- 1329 E Kaylynne Cir
- 64 N Bywater Way
- 1228 Sheri Cir
- 637 E 950 S Unit 19
- 637 E 950 S Unit 21
- 637 E 950 S Unit 6
- 770 E 350 S
- 800 E 100 S Unit 1
- 780 E 100 S Unit 1
- 885 S Arapaho Ct Unit 10
- 867 S Arapaho Ct
- 1010 E 200 N
Your Personal Tour Guide
Ask me questions while you tour the home.