Estimated Value: $196,055 - $222,000
2
Beds
1
Bath
660
Sq Ft
$315/Sq Ft
Est. Value
About This Home
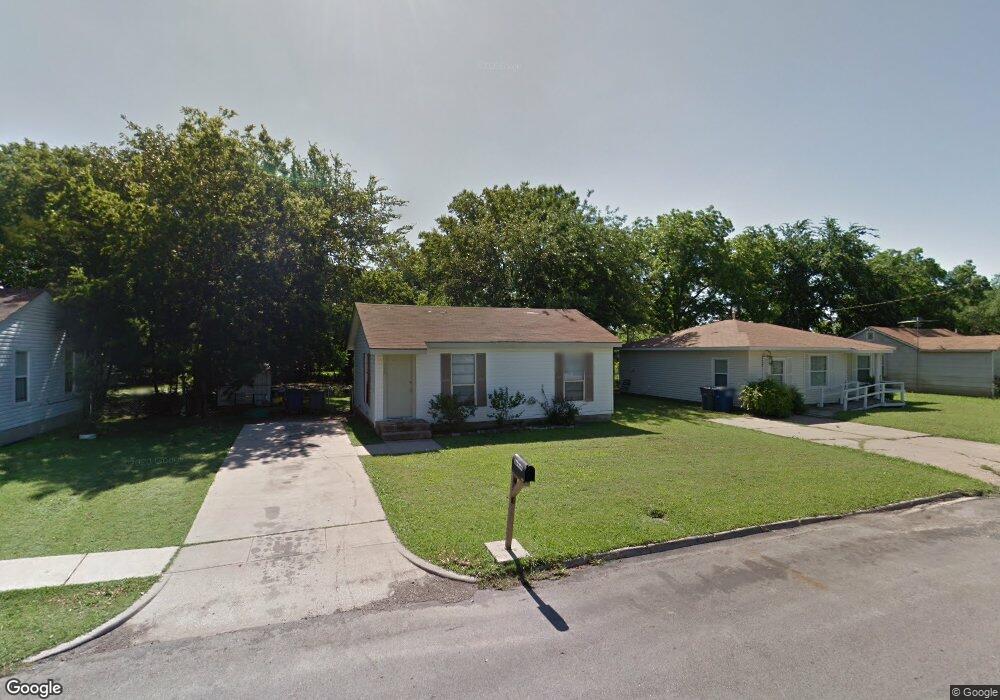
This home is located at 325 S 2nd St, Wylie, TX 75098 and is currently estimated at $208,014, approximately $315 per square foot. 325 S 2nd St is a home located in Collin County with nearby schools including R F Hartman Elementary School, AB Harrison Intermediate School, and Grady Burnett J High School.
Ownership History
Date
Name
Owned For
Owner Type
Purchase Details
Closed on
Jan 23, 2019
Sold by
Parkarosa Ltd
Bought by
Endres Rita and Endres Dan
Current Estimated Value
Home Financials for this Owner
Home Financials are based on the most recent Mortgage that was taken out on this home.
Original Mortgage
$77,500
Outstanding Balance
$68,138
Interest Rate
4.6%
Mortgage Type
Purchase Money Mortgage
Estimated Equity
$139,876
Purchase Details
Closed on
Feb 11, 2011
Sold by
Anderson Jennifer
Bought by
Parkarosa
Purchase Details
Closed on
May 27, 2004
Sold by
J & K Properties Ltd
Bought by
Anderson Jennifer
Home Financials for this Owner
Home Financials are based on the most recent Mortgage that was taken out on this home.
Original Mortgage
$38,250
Interest Rate
5.97%
Purchase Details
Closed on
Sep 9, 2002
Sold by
Anderson Keith and Anderson Jennifer
Bought by
J & K Properties Ltd
Create a Home Valuation Report for This Property
The Home Valuation Report is an in-depth analysis detailing your home's value as well as a comparison with similar homes in the area
Home Values in the Area
Average Home Value in this Area
Purchase History
| Date | Buyer | Sale Price | Title Company |
|---|---|---|---|
| Endres Rita | -- | Lawyers Title | |
| Parkarosa | -- | Ltic | |
| Anderson Jennifer | -- | -- | |
| J & K Properties Ltd | -- | -- |
Source: Public Records
Mortgage History
| Date | Status | Borrower | Loan Amount |
|---|---|---|---|
| Open | Endres Rita | $77,500 | |
| Previous Owner | Anderson Jennifer | $38,250 |
Source: Public Records
Tax History Compared to Growth
Tax History
| Year | Tax Paid | Tax Assessment Tax Assessment Total Assessment is a certain percentage of the fair market value that is determined by local assessors to be the total taxable value of land and additions on the property. | Land | Improvement |
|---|---|---|---|---|
| 2025 | $3,250 | $174,470 | $70,000 | $104,470 |
| 2024 | $3,250 | $164,552 | $70,000 | $94,552 |
| 2023 | $3,250 | $173,403 | $70,000 | $103,403 |
| 2022 | $3,365 | $153,392 | $60,000 | $93,392 |
| 2021 | $3,129 | $133,000 | $55,000 | $78,000 |
| 2020 | $3,024 | $121,796 | $40,000 | $81,796 |
| 2019 | $3,349 | $127,458 | $40,000 | $87,458 |
| 2018 | $2,166 | $80,446 | $40,000 | $40,446 |
| 2017 | $1,728 | $64,164 | $30,000 | $34,164 |
| 2016 | $1,375 | $49,493 | $20,000 | $29,493 |
| 2015 | $1,264 | $48,839 | $20,000 | $28,839 |
Source: Public Records
Map
Nearby Homes
- 329 S 2nd St
- 327 S 4th St
- 702 S Ballard Ave
- 416 S 1st St
- 301 S 3rd St
- 300 Woodhollow Ct
- 414 Briarwood Dr
- 306 Woodhollow Ct
- 416 Dogwood Dr
- 300 S Cottonbelt Ave Unit 3A
- 205 S Cottonbelt Ave
- 104 Rushcreek Dr
- 104 N 5th St
- 811 Forest Edge Ln
- 804 Memorial Dr
- 217 Cloudcroft Dr
- 1022 Debby Ct
- 307 Memorial Dr
- 903 Mardi Gras Ln
- 303 N 2nd St