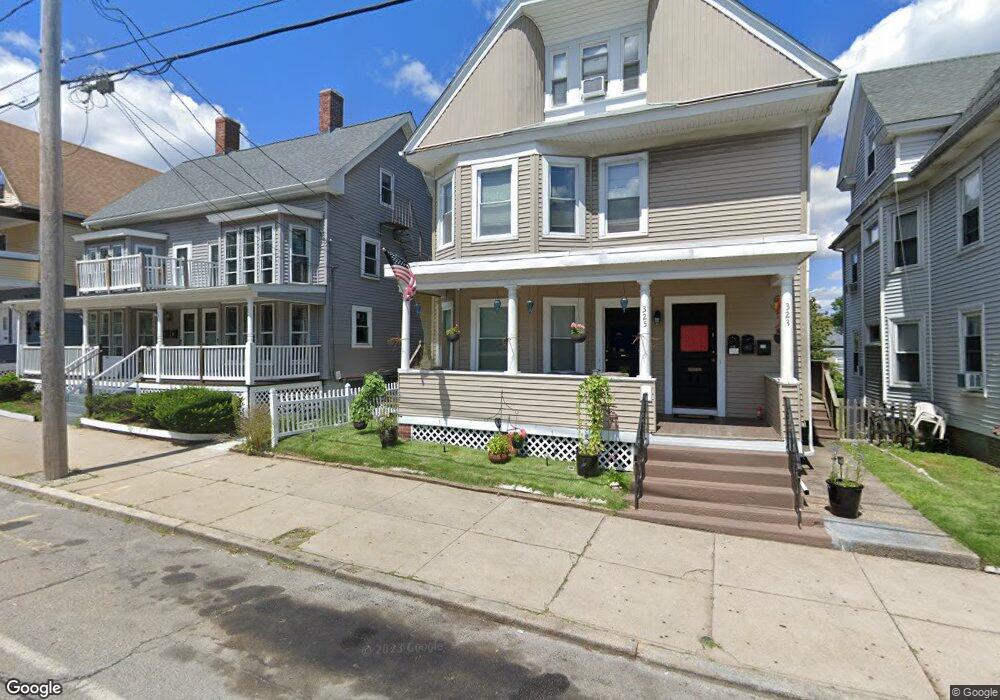
325 S Main St Woonsocket, RI 02895
Constitution Hill NeighborhoodEstimated Value: $528,000 - $570,000
6
Beds
2
Baths
2,873
Sq Ft
$190/Sq Ft
Est. Value
About This Home
This home is located at 325 S Main St, Woonsocket, RI 02895 and is currently estimated at $546,759, approximately $190 per square foot. 325 S Main St is a home located in Providence County with nearby schools including Woonsocket High School, Founders Academy, and Beacon Charter School.
Ownership History
Date
Name
Owned For
Owner Type
Purchase Details
Closed on
Aug 2, 2016
Sold by
Chester Christopher J
Bought by
Smsa Llc
Current Estimated Value
Purchase Details
Closed on
Jul 17, 2015
Sold by
Spatz Marc
Bought by
Chester Christopher
Home Financials for this Owner
Home Financials are based on the most recent Mortgage that was taken out on this home.
Original Mortgage
$65,000
Interest Rate
4.03%
Purchase Details
Closed on
Aug 27, 2008
Sold by
Us Bank Na
Bought by
Spatz Marc
Home Financials for this Owner
Home Financials are based on the most recent Mortgage that was taken out on this home.
Original Mortgage
$62,800
Interest Rate
6.29%
Mortgage Type
Purchase Money Mortgage
Create a Home Valuation Report for This Property
The Home Valuation Report is an in-depth analysis detailing your home's value as well as a comparison with similar homes in the area
Home Values in the Area
Average Home Value in this Area
Purchase History
| Date | Buyer | Sale Price | Title Company |
|---|---|---|---|
| Smsa Llc | -- | -- | |
| Smsa Llc | -- | -- | |
| Chester Christopher | $75,000 | -- | |
| Chester Christopher | $75,000 | -- | |
| Spatz Marc | $78,500 | -- | |
| Spatz Marc | $78,500 | -- |
Source: Public Records
Mortgage History
| Date | Status | Borrower | Loan Amount |
|---|---|---|---|
| Previous Owner | Spatz Marc | $65,000 | |
| Previous Owner | Spatz Marc | $62,800 |
Source: Public Records
Tax History
| Year | Tax Paid | Tax Assessment Tax Assessment Total Assessment is a certain percentage of the fair market value that is determined by local assessors to be the total taxable value of land and additions on the property. | Land | Improvement |
|---|---|---|---|---|
| 2025 | $5,520 | $491,500 | $83,800 | $407,700 |
| 2024 | $4,688 | $322,400 | $85,300 | $237,100 |
| 2023 | $4,507 | $322,400 | $85,300 | $237,100 |
| 2022 | $4,507 | $322,400 | $85,300 | $237,100 |
| 2021 | $3,909 | $164,600 | $34,300 | $130,300 |
| 2020 | $3,950 | $164,600 | $34,300 | $130,300 |
| 2018 | $3,930 | $163,200 | $34,300 | $128,900 |
| 2017 | $4,334 | $144,000 | $38,100 | $105,900 |
| 2016 | $4,585 | $144,000 | $38,100 | $105,900 |
| 2015 | $5,268 | $144,000 | $38,100 | $105,900 |
| 2014 | $4,475 | $124,500 | $41,900 | $82,600 |
Source: Public Records
Map
Nearby Homes
- 0 Holbrook Ln Unit 1402850
- 120 East St
- 435 S Main St
- 190 Coe St
- 42 Transit St
- 43 Summit St
- 83 4th Ave
- 123 4th Ave
- 184 Avenue C Unit 2
- 184 Avenue C Unit 5
- 184 Avenue C Unit 6
- 184 Avenue C Unit 3
- 184 Avenue C Unit 4
- 184 Avenue C Unit 1
- 84 Bernice Ave
- 379 Front St
- 122 Grand St
- 217 4th Ave
- 372 River St
- 36 Fairmount St
- 323 S Main St
- 321 S Main St
- 329 S Main St
- 319 S Main St
- 331 S Main St
- 315 S Main St
- 335 S Main St
- 309 S Main St
- 120 Pleasant St
- 0 Holbrook Ln Unit 1294606
- 103 Pleasant St
- 62 Pleasant St
- 115 Pleasant St
- 345 S Main St
- 87 Pleasant St
- 129 Pleasant St
- 60 Pleasant St Unit 64
- 293 S Main St
- 300 S Main St
- 349 S Main St Unit 3
Your Personal Tour Guide
Ask me questions while you tour the home.