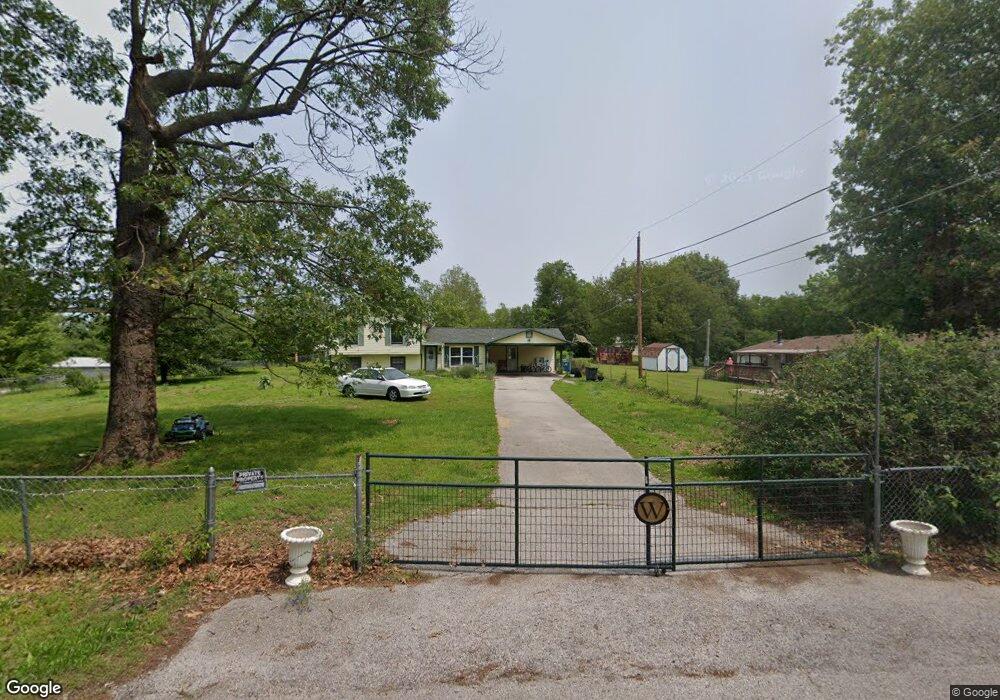
325 Sampson St Oronogo, MO 64855
Estimated Value: $223,000 - $246,538
4
Beds
2
Baths
1,826
Sq Ft
$128/Sq Ft
Est. Value
About This Home
This home is located at 325 Sampson St, Oronogo, MO 64855 and is currently estimated at $232,885, approximately $127 per square foot. 325 Sampson St is a home located in Jasper County with nearby schools including Webb City High School.
Ownership History
Date
Name
Owned For
Owner Type
Purchase Details
Closed on
Aug 18, 2020
Sold by
Dearmond Aaron and Dearmon Julie
Bought by
Eininger Edmond L
Current Estimated Value
Home Financials for this Owner
Home Financials are based on the most recent Mortgage that was taken out on this home.
Original Mortgage
$145,454
Outstanding Balance
$128,737
Interest Rate
3%
Mortgage Type
New Conventional
Estimated Equity
$104,148
Purchase Details
Closed on
Dec 21, 2006
Sold by
Taylor Penni
Bought by
Dearmond Aaron and Dearmond Julie
Home Financials for this Owner
Home Financials are based on the most recent Mortgage that was taken out on this home.
Original Mortgage
$94,050
Interest Rate
6.27%
Mortgage Type
Purchase Money Mortgage
Purchase Details
Closed on
Sep 29, 2005
Sold by
Walker Henry S and Walker Patricia J
Bought by
Taylor Penni
Home Financials for this Owner
Home Financials are based on the most recent Mortgage that was taken out on this home.
Original Mortgage
$101,000
Interest Rate
8.25%
Mortgage Type
Purchase Money Mortgage
Create a Home Valuation Report for This Property
The Home Valuation Report is an in-depth analysis detailing your home's value as well as a comparison with similar homes in the area
Home Values in the Area
Average Home Value in this Area
Purchase History
| Date | Buyer | Sale Price | Title Company |
|---|---|---|---|
| Eininger Edmond L | -- | None Available | |
| Dearmond Aaron | -- | Fatco | |
| Taylor Penni | -- | Barrister Title Services Llc |
Source: Public Records
Mortgage History
| Date | Status | Borrower | Loan Amount |
|---|---|---|---|
| Open | Eininger Edmond L | $145,454 | |
| Previous Owner | Dearmond Aaron | $94,050 | |
| Previous Owner | Taylor Penni | $101,000 |
Source: Public Records
Tax History Compared to Growth
Tax History
| Year | Tax Paid | Tax Assessment Tax Assessment Total Assessment is a certain percentage of the fair market value that is determined by local assessors to be the total taxable value of land and additions on the property. | Land | Improvement |
|---|---|---|---|---|
| 2025 | $1,040 | $22,240 | $1,380 | $20,860 |
| 2024 | $1,041 | $20,040 | $1,380 | $18,660 |
| 2023 | $1,041 | $20,040 | $1,380 | $18,660 |
| 2022 | $1,027 | $19,830 | $1,380 | $18,450 |
| 2021 | $1,021 | $19,830 | $1,380 | $18,450 |
| 2020 | $589 | $11,920 | $1,380 | $10,540 |
| 2019 | $590 | $11,920 | $1,380 | $10,540 |
| 2018 | $635 | $12,850 | $0 | $0 |
| 2017 | $636 | $12,850 | $0 | $0 |
| 2016 | $612 | $13,260 | $0 | $0 |
| 2015 | -- | $13,260 | $0 | $0 |
| 2014 | -- | $13,260 | $0 | $0 |
Source: Public Records
Map
Nearby Homes
- TBD S 4th St
- 190 Alvin Ct
- 350 Swaden Ln
- 272 Elk St
- Tbd E Central St
- 471 W Amber Dr
- 918 Caitlan Dr
- 912 E Amber Dr
- 1068 Alexsandra Cir
- 8991 County Road 220
- 226 S Highway D
- 000 State Highway 96
- 793 N State Hwy D
- 628 Josh Ct
- 8940 County Lane 214
- 8740 County Road 241
- 8755 County Road 241
- 2237 N Greystone Square
- 9960 Cr 215
- 2003 Blue Jay Dr