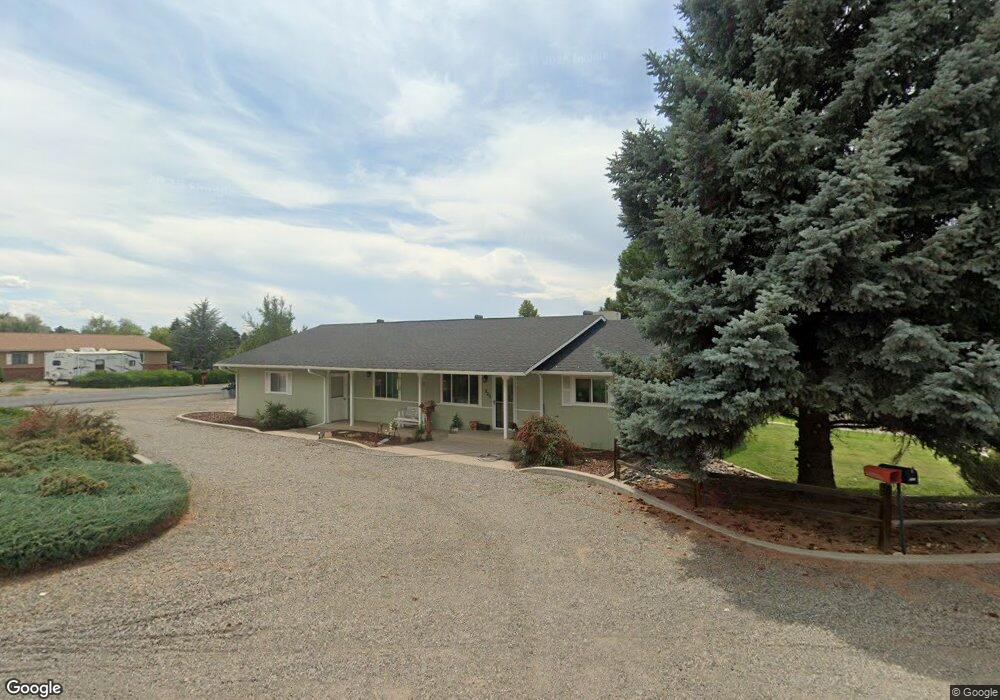
325 SW 8th Ave Cedaredge, CO 81413
Estimated Value: $379,000 - $498,000
3
Beds
2
Baths
1,716
Sq Ft
$255/Sq Ft
Est. Value
About This Home
This home is located at 325 SW 8th Ave, Cedaredge, CO 81413 and is currently estimated at $437,562, approximately $254 per square foot. 325 SW 8th Ave is a home located in Delta County with nearby schools including Cedaredge Elementary School, Cedaredge Middle School, and Cedaredge High School.
Ownership History
Date
Name
Owned For
Owner Type
Purchase Details
Closed on
May 1, 2007
Sold by
Gamble Curtis R and Gamble Carol W
Bought by
Pinkerton James and Pinkerton Elsie
Current Estimated Value
Purchase Details
Closed on
Mar 4, 2005
Sold by
Fivecoate Clarence E and Fivecoate Judith T
Bought by
Gamble Curtis R and Gamble Carol W
Home Financials for this Owner
Home Financials are based on the most recent Mortgage that was taken out on this home.
Original Mortgage
$163,200
Interest Rate
5.5%
Mortgage Type
Adjustable Rate Mortgage/ARM
Purchase Details
Closed on
Oct 31, 2001
Sold by
Hieber Steven E
Bought by
Pinkerton James and Fivecoat Clarence E
Purchase Details
Closed on
May 29, 1992
Sold by
Hughes
Bought by
Hieber Pinkerton James and Hieber Pinkerton
Purchase Details
Closed on
Jan 29, 1987
Bought by
Pinkerton James
Create a Home Valuation Report for This Property
The Home Valuation Report is an in-depth analysis detailing your home's value as well as a comparison with similar homes in the area
Home Values in the Area
Average Home Value in this Area
Purchase History
| Date | Buyer | Sale Price | Title Company |
|---|---|---|---|
| Pinkerton James | $249,000 | Fahtco | |
| Gamble Curtis R | $207,000 | Fahtco | |
| Pinkerton James | $163,000 | -- | |
| Hieber Pinkerton James | $64,500 | -- | |
| Pinkerton James | $9,500 | -- |
Source: Public Records
Mortgage History
| Date | Status | Borrower | Loan Amount |
|---|---|---|---|
| Previous Owner | Gamble Curtis R | $163,200 |
Source: Public Records
Tax History Compared to Growth
Tax History
| Year | Tax Paid | Tax Assessment Tax Assessment Total Assessment is a certain percentage of the fair market value that is determined by local assessors to be the total taxable value of land and additions on the property. | Land | Improvement |
|---|---|---|---|---|
| 2024 | $1,354 | $26,570 | $2,942 | $23,628 |
| 2023 | $1,354 | $26,570 | $2,942 | $23,628 |
| 2022 | $942 | $21,007 | $2,016 | $18,991 |
| 2021 | $938 | $21,612 | $2,074 | $19,538 |
| 2020 | $643 | $16,771 | $1,845 | $14,926 |
| 2019 | $642 | $16,771 | $1,845 | $14,926 |
| 2018 | $538 | $14,881 | $1,800 | $13,081 |
| 2017 | $1,041 | $14,881 | $1,800 | $13,081 |
| 2016 | $1,041 | $16,158 | $2,189 | $13,969 |
| 2014 | -- | $18,548 | $2,348 | $16,200 |
Source: Public Records
Map
Nearby Homes
- 340 SW 8th Ave
- 215 SW 8th Cir
- 640 3/4 S Grand Mesa Dr
- 1266 SW 11th Ave
- 1010 SW 11th Ave
- 1006 SW 11th Ave
- 320 SW 8th St
- 540 SW 3rd Ave
- 515 SE 2nd St
- 720 SE Stonebridge Dr
- 135 SE Buffalo Ave
- 305 SE Limestone Ct
- 320 SE Flagstone Ct
- 155 SE Buffalo Ave
- 105 SE Buffalo Ave
- 520 SE Stonebridge Dr
- Lot 4, TBD SE Stonebridge Dr
- Lot 1, TBD SE Stonebridge Dr
- Lot 3, TBD SE Stonebridge Dr
- Lot 2, TBD SE Stonebridge Dr