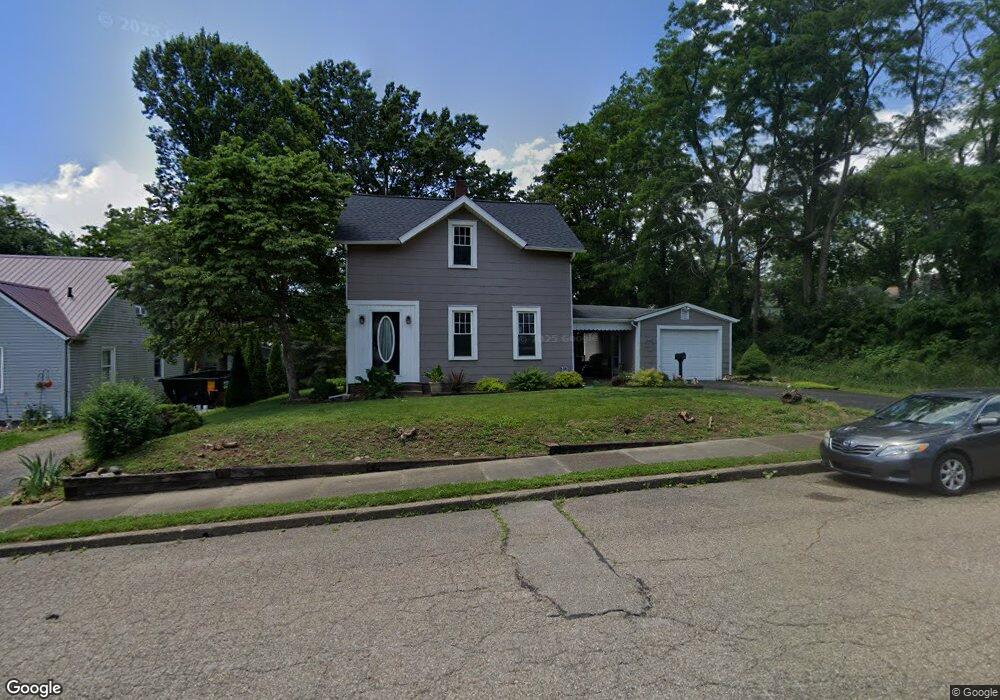
325 Tuscarawas St NE Navarre, OH 44662
Estimated Value: $117,860 - $158,000
3
Beds
2
Baths
792
Sq Ft
$173/Sq Ft
Est. Value
About This Home
This home is located at 325 Tuscarawas St NE, Navarre, OH 44662 and is currently estimated at $137,215, approximately $173 per square foot. 325 Tuscarawas St NE is a home located in Stark County with nearby schools including Fairless Elementary School, Fairless Middle School, and Fairless High School.
Ownership History
Date
Name
Owned For
Owner Type
Purchase Details
Closed on
Feb 22, 1994
Current Estimated Value
Create a Home Valuation Report for This Property
The Home Valuation Report is an in-depth analysis detailing your home's value as well as a comparison with similar homes in the area
Home Values in the Area
Average Home Value in this Area
Purchase History
| Date | Buyer | Sale Price | Title Company |
|---|---|---|---|
| -- | -- | -- |
Source: Public Records
Tax History Compared to Growth
Tax History
| Year | Tax Paid | Tax Assessment Tax Assessment Total Assessment is a certain percentage of the fair market value that is determined by local assessors to be the total taxable value of land and additions on the property. | Land | Improvement |
|---|---|---|---|---|
| 2025 | -- | $27,130 | $12,250 | $14,880 |
| 2024 | -- | $27,130 | $12,250 | $14,880 |
| 2023 | $329 | $25,450 | $9,770 | $15,680 |
| 2022 | $1,105 | $25,450 | $9,770 | $15,680 |
| 2021 | $1,109 | $25,450 | $9,770 | $15,680 |
| 2020 | $891 | $19,250 | $7,770 | $11,480 |
| 2019 | $872 | $19,250 | $7,770 | $11,480 |
| 2018 | $881 | $19,250 | $7,770 | $11,480 |
| 2017 | $769 | $16,000 | $6,230 | $9,770 |
| 2016 | $772 | $16,000 | $6,230 | $9,770 |
| 2015 | $705 | $16,000 | $6,230 | $9,770 |
| 2014 | $723 | $15,370 | $6,200 | $9,170 |
| 2013 | $364 | $15,370 | $6,200 | $9,170 |
Source: Public Records
Map
Nearby Homes
- 315 Tuscarawas St NE
- 233 Tuscarawas St NE
- 36 2nd St NE
- 330 Tuscarawas St NE
- 0 2nd St NE Unit 3139720
- 33 Wooster St NE
- 41 Wooster St NE
- 27 Wooster St NE
- 320 Tuscarawas St NE
- 404 Tuscarawas St NE
- 0 Main St N Unit 4397082
- 0 Main St N Unit 4368367
- 102 2nd St NE
- 23 Wooster St NE
- 108 2nd St NE
- 103 Wooster St NE
- 19 Wooster St NE
- 239 Tuscarawas St NE
- 111 Eastern Place NE
- 112 2nd St NE