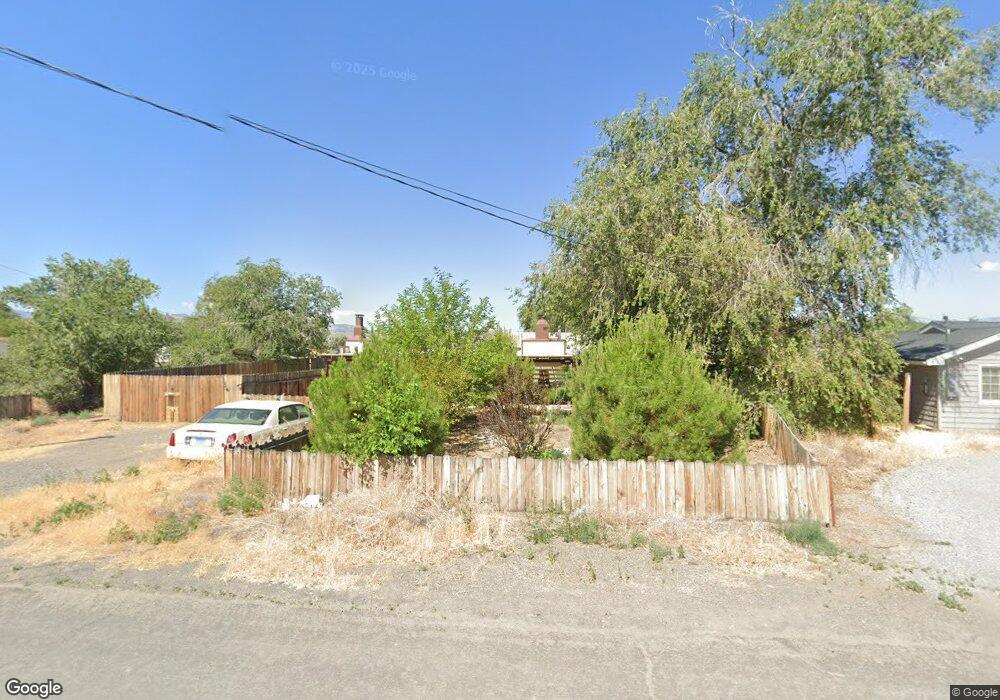
325 Vine St Fernley, NV 89408
Estimated Value: $272,000 - $405,000
2
Beds
1
Bath
1,873
Sq Ft
$191/Sq Ft
Est. Value
About This Home
This home is located at 325 Vine St, Fernley, NV 89408 and is currently estimated at $358,270, approximately $191 per square foot. 325 Vine St is a home located in Lyon County with nearby schools including Fernley Elementary School, Fernley Intermediate School, and Fernley High School.
Ownership History
Date
Name
Owned For
Owner Type
Purchase Details
Closed on
Aug 19, 2016
Sold by
Clark Sharon L
Bought by
Knopoff Couch Sharon Lee and Sharon Lee Knopoff Couch Revocable Livin
Current Estimated Value
Purchase Details
Closed on
Dec 2, 2009
Sold by
Deutsche Bank National Trust Company
Bought by
Clark Sharon L
Purchase Details
Closed on
Feb 8, 2008
Sold by
Graham Monique
Bought by
Deutsche Bank National Trust Co and Registered Holders Of Argent Securities
Purchase Details
Closed on
Aug 26, 2005
Sold by
Block Wayne D and Block Wynona D
Bought by
Graham Monique
Home Financials for this Owner
Home Financials are based on the most recent Mortgage that was taken out on this home.
Original Mortgage
$221,000
Interest Rate
7.3%
Mortgage Type
Adjustable Rate Mortgage/ARM
Create a Home Valuation Report for This Property
The Home Valuation Report is an in-depth analysis detailing your home's value as well as a comparison with similar homes in the area
Home Values in the Area
Average Home Value in this Area
Purchase History
| Date | Buyer | Sale Price | Title Company |
|---|---|---|---|
| Knopoff Couch Sharon Lee | -- | None Available | |
| Clark Sharon L | $41,000 | Ticor Title Of Nevada Inc | |
| Deutsche Bank National Trust Co | $199,077 | First American Title Ins Co | |
| Graham Monique | $260,000 | Western Title Company |
Source: Public Records
Mortgage History
| Date | Status | Borrower | Loan Amount |
|---|---|---|---|
| Previous Owner | Graham Monique | $221,000 |
Source: Public Records
Tax History Compared to Growth
Tax History
| Year | Tax Paid | Tax Assessment Tax Assessment Total Assessment is a certain percentage of the fair market value that is determined by local assessors to be the total taxable value of land and additions on the property. | Land | Improvement |
|---|---|---|---|---|
| 2025 | $1,230 | $68,999 | $41,650 | $27,349 |
| 2024 | $1,893 | $68,962 | $41,650 | $27,312 |
| 2023 | $1,893 | $66,696 | $41,650 | $25,046 |
| 2022 | $1,772 | $65,060 | $41,650 | $23,410 |
| 2021 | $1,795 | $57,307 | $35,000 | $22,307 |
| 2020 | $1,769 | $55,822 | $35,000 | $20,822 |
| 2019 | $1,677 | $54,802 | $35,000 | $19,802 |
| 2018 | $1,654 | $46,892 | $28,000 | $18,892 |
| 2017 | $1,730 | $32,793 | $14,000 | $18,793 |
| 2016 | $1,189 | $19,740 | $8,400 | $11,340 |
| 2015 | $1,270 | $13,984 | $8,400 | $5,584 |
| 2014 | $1,206 | $18,392 | $8,400 | $9,992 |
Source: Public Records
Map
Nearby Homes