Estimated Value: $442,000 - $472,000
4
Beds
3
Baths
2,481
Sq Ft
$182/Sq Ft
Est. Value
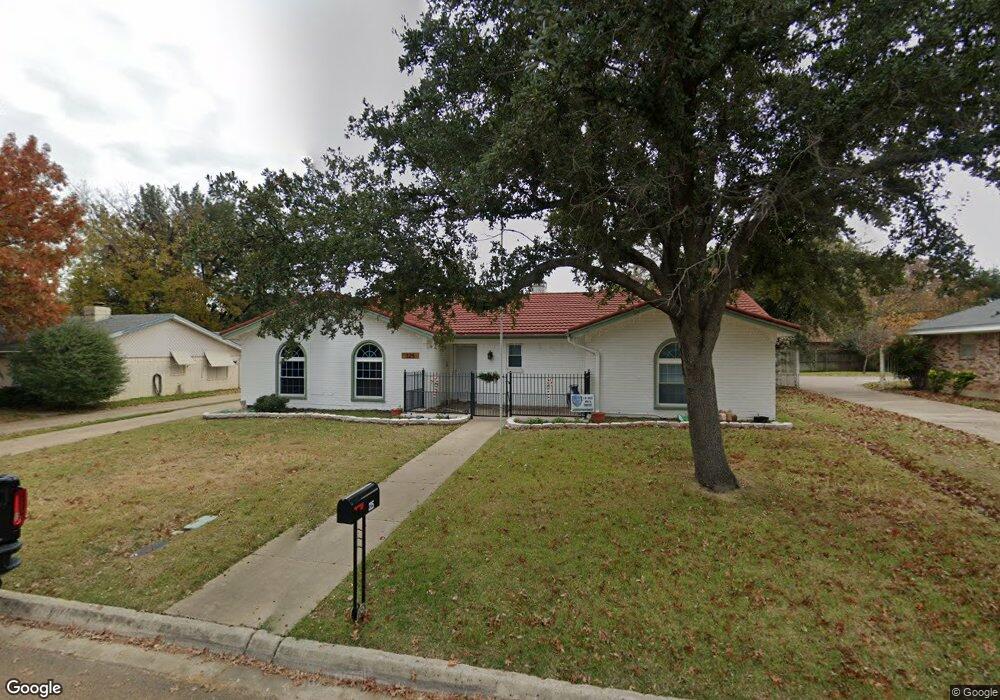
About This Home
This home is located at 325 W Pleasantview Dr, Hurst, TX 76054 and is currently estimated at $452,088, approximately $182 per square foot. 325 W Pleasantview Dr is a home located in Tarrant County with nearby schools including Shady Oaks Elementary School, Bedford Junior High School, and L.D. Bell High School.
Ownership History
Date
Name
Owned For
Owner Type
Purchase Details
Closed on
Jul 15, 2020
Sold by
Parrett Hubert M and Parrett Maria P
Bought by
Rutschman Trey J and Rutschman Jennifer L
Current Estimated Value
Home Financials for this Owner
Home Financials are based on the most recent Mortgage that was taken out on this home.
Original Mortgage
$296,530
Outstanding Balance
$262,943
Interest Rate
3.1%
Mortgage Type
FHA
Estimated Equity
$189,145
Purchase Details
Closed on
Mar 30, 2020
Sold by
Mullenax Kathleen Ann
Bought by
Parrett Hubert M
Home Financials for this Owner
Home Financials are based on the most recent Mortgage that was taken out on this home.
Original Mortgage
$232,400
Interest Rate
3.4%
Mortgage Type
New Conventional
Purchase Details
Closed on
Dec 17, 2018
Sold by
Mullenax Craig Steven
Bought by
Mullenax Kathleen Ann
Purchase Details
Closed on
Aug 30, 2017
Sold by
Bergman Buddy J and Bergman Wongduean
Bought by
Mullenax Kathleen
Home Financials for this Owner
Home Financials are based on the most recent Mortgage that was taken out on this home.
Original Mortgage
$222,400
Interest Rate
3.96%
Mortgage Type
New Conventional
Purchase Details
Closed on
Jun 2, 2014
Sold by
Peterman Eric and Peterman Kelly
Bought by
Bergman Buddy J and Bergman Wongduean
Home Financials for this Owner
Home Financials are based on the most recent Mortgage that was taken out on this home.
Original Mortgage
$215,000
Interest Rate
4.32%
Mortgage Type
VA
Purchase Details
Closed on
Jul 25, 2002
Sold by
Noland Robert P and Noland Donna L
Bought by
Peterman Eric
Home Financials for this Owner
Home Financials are based on the most recent Mortgage that was taken out on this home.
Original Mortgage
$116,000
Interest Rate
6.69%
Purchase Details
Closed on
Dec 15, 1997
Sold by
Va
Bought by
Noland Robert P and Noland Donna L
Home Financials for this Owner
Home Financials are based on the most recent Mortgage that was taken out on this home.
Original Mortgage
$135,850
Interest Rate
7.25%
Mortgage Type
Seller Take Back
Purchase Details
Closed on
May 31, 1994
Sold by
Campbell Craig E and Campbell Deborah
Bought by
Simon Roland D and Simon Michelle M
Home Financials for this Owner
Home Financials are based on the most recent Mortgage that was taken out on this home.
Original Mortgage
$108,000
Interest Rate
8.45%
Mortgage Type
Seller Take Back
Create a Home Valuation Report for This Property
The Home Valuation Report is an in-depth analysis detailing your home's value as well as a comparison with similar homes in the area
Home Values in the Area
Average Home Value in this Area
Purchase History
| Date | Buyer | Sale Price | Title Company |
|---|---|---|---|
| Rutschman Trey J | -- | Capital Title | |
| Parrett Hubert M | -- | None Available | |
| Mullenax Kathleen Ann | -- | None Available | |
| Mullenax Kathleen | -- | None Available | |
| Bergman Buddy J | -- | Fatco | |
| Peterman Eric | -- | Stewart Title | |
| Noland Robert P | -- | -- | |
| Simon Roland D | -- | -- |
Source: Public Records
Mortgage History
| Date | Status | Borrower | Loan Amount |
|---|---|---|---|
| Open | Rutschman Trey J | $296,530 | |
| Previous Owner | Parrett Hubert M | $232,400 | |
| Previous Owner | Mullenax Kathleen | $222,400 | |
| Previous Owner | Bergman Buddy J | $215,000 | |
| Previous Owner | Peterman Eric | $116,000 | |
| Previous Owner | Noland Robert P | $135,850 | |
| Previous Owner | Simon Roland D | $108,000 | |
| Closed | Simon Roland D | $7,475 |
Source: Public Records
Tax History Compared to Growth
Tax History
| Year | Tax Paid | Tax Assessment Tax Assessment Total Assessment is a certain percentage of the fair market value that is determined by local assessors to be the total taxable value of land and additions on the property. | Land | Improvement |
|---|---|---|---|---|
| 2025 | $6,267 | $449,807 | $80,000 | $369,807 |
| 2024 | $6,267 | $449,807 | $80,000 | $369,807 |
| 2023 | $7,175 | $477,252 | $55,000 | $422,252 |
| 2022 | $7,497 | $360,766 | $55,000 | $305,766 |
| 2021 | $7,139 | $296,000 | $55,000 | $241,000 |
| 2020 | $6,628 | $275,500 | $55,000 | $220,500 |
| 2019 | $6,743 | $275,500 | $55,000 | $220,500 |
| 2018 | $7,010 | $286,394 | $55,000 | $231,394 |
| 2017 | $5,311 | $209,896 | $40,000 | $169,896 |
| 2016 | $4,896 | $193,476 | $40,000 | $153,476 |
| 2015 | $3,367 | $145,600 | $17,000 | $128,600 |
| 2014 | $3,367 | $145,600 | $17,000 | $128,600 |
Source: Public Records
Map
Nearby Homes
- 229 Brookview Dr
- 425 W Pleasantview Dr
- 440 W Louella Dr
- 100 Hillview Ct
- 521 Brookview Dr
- 520 Baker Dr
- 608 W Pleasantview Dr
- 113 Sunnyvale Terrace
- 1352 Simpson Dr
- 1337 Harrison Ln
- 1348 Norwood Dr
- 124 Jeannie Ct
- 121 Kay Ct
- 1732 Jeannie Ln
- 116 Oakhurst Dr
- 1625 Oak Creek Dr
- 421 Cavender Ct
- 1220 Norwood Dr
- 409 Vicki Place
- 432 Sunnybrook Ct
- 329 W Pleasantview Dr
- 321 W Pleasantview Dr
- 316 Brookview Dr
- 320 Brookview Dr
- 333 W Pleasantview Dr
- 312 Brookview Dr
- 317 W Pleasantview Dr
- 324 W Pleasantview Dr
- 324 Brookview Dr
- 328 W Pleasantview Dr
- 320 W Pleasantview Dr
- 332 W Pleasantview Dr
- 308 Brookview Dr
- 337 W Pleasantview Dr
- 316 W Pleasantview Dr
- 313 W Pleasantview Dr
- 328 Brookview Dr
- 325 Brookview Dr
- 321 Brookview Dr
- 325 Circleview Dr S