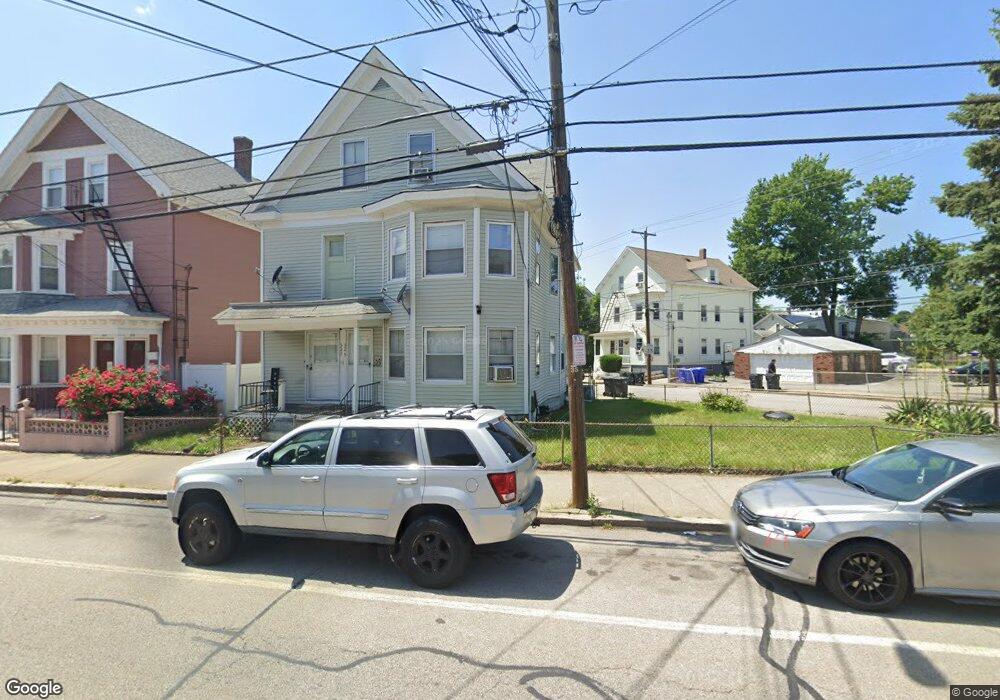
325 West Ave Pawtucket, RI 02860
Woodlawn NeighborhoodEstimated Value: $418,302 - $654,000
5
Beds
3
Baths
728
Sq Ft
$773/Sq Ft
Est. Value
About This Home
This home is located at 325 West Ave, Pawtucket, RI 02860 and is currently estimated at $562,826, approximately $773 per square foot. 325 West Ave is a home located in Providence County with nearby schools including International Charter School, Blackstone Academy Charter School, and Ocean Tides School.
Ownership History
Date
Name
Owned For
Owner Type
Purchase Details
Closed on
Oct 12, 1994
Sold by
Clark Marion and Shammas Malcolm A
Bought by
Rogers Stanley W and Rogers Carol
Current Estimated Value
Home Financials for this Owner
Home Financials are based on the most recent Mortgage that was taken out on this home.
Original Mortgage
$101,420
Interest Rate
8.43%
Create a Home Valuation Report for This Property
The Home Valuation Report is an in-depth analysis detailing your home's value as well as a comparison with similar homes in the area
Home Values in the Area
Average Home Value in this Area
Purchase History
| Date | Buyer | Sale Price | Title Company |
|---|---|---|---|
| Rogers Stanley W | $104,000 | -- |
Source: Public Records
Mortgage History
| Date | Status | Borrower | Loan Amount |
|---|---|---|---|
| Open | Rogers Stanley W | $145,000 | |
| Closed | Rogers Stanley W | $165,000 | |
| Closed | Rogers Stanley W | $101,420 |
Source: Public Records
Tax History
| Year | Tax Paid | Tax Assessment Tax Assessment Total Assessment is a certain percentage of the fair market value that is determined by local assessors to be the total taxable value of land and additions on the property. | Land | Improvement |
|---|---|---|---|---|
| 2025 | $5,398 | $410,500 | $65,500 | $345,000 |
| 2024 | $5,066 | $410,500 | $65,500 | $345,000 |
| 2023 | $4,740 | $279,800 | $36,400 | $243,400 |
| 2022 | $4,639 | $279,800 | $36,400 | $243,400 |
| 2021 | $4,639 | $279,800 | $36,400 | $243,400 |
| 2020 | $4,097 | $196,100 | $48,500 | $147,600 |
| 2019 | $4,097 | $196,100 | $48,500 | $147,600 |
| 2018 | $3,947 | $196,100 | $48,500 | $147,600 |
| 2017 | $3,946 | $173,700 | $47,100 | $126,600 |
| 2016 | $3,802 | $173,700 | $47,100 | $126,600 |
| 2015 | $3,802 | $173,700 | $47,100 | $126,600 |
| 2014 | $3,081 | $133,600 | $47,100 | $86,500 |
Source: Public Records
Map
Nearby Homes
- 126 Dunnell Ave
- 159 Dunnell Ave
- 11 Sherman St
- 50 Jefferson Ave
- 54 Jefferson Ave
- 187 Sisson St
- 163 West Ave
- 167 George St
- 107 Mulberry St
- 5 Brown St
- 349 Pleasant St
- 345 Pleasant St
- 51 Wilcox Ave
- 59 West Ave
- 44 Pawtucket Ave
- 57 Garden St
- 41 Campbell Terrace
- 122 Lowden St
- 17 Grotto Ave Unit 1
- 193 Harrison St
Your Personal Tour Guide
Ask me questions while you tour the home.