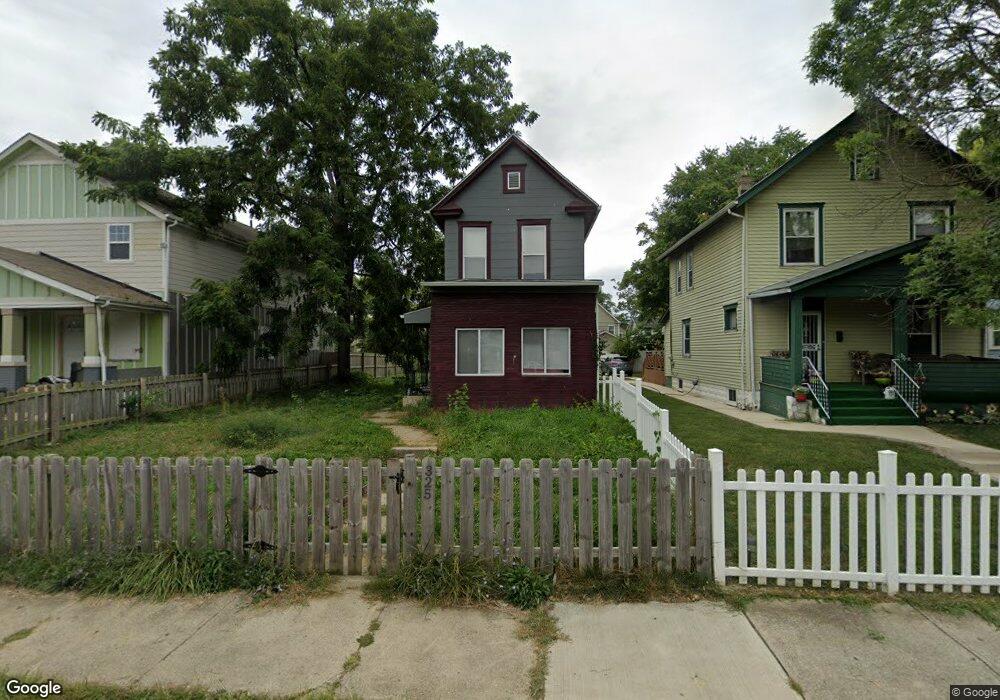
325 Whitethorne Ave Columbus, OH 43223
Central Hilltop NeighborhoodEstimated Value: $164,000 - $190,000
3
Beds
1
Bath
1,380
Sq Ft
$131/Sq Ft
Est. Value
About This Home
This home is located at 325 Whitethorne Ave, Columbus, OH 43223 and is currently estimated at $180,333, approximately $130 per square foot. 325 Whitethorne Ave is a home located in Franklin County with nearby schools including Highland Elementary School, Westmoor Middle School, and West High School.
Ownership History
Date
Name
Owned For
Owner Type
Purchase Details
Closed on
Nov 18, 2021
Sold by
Sharon Holmes Llc
Bought by
Fgw Investment Properties Llc
Current Estimated Value
Home Financials for this Owner
Home Financials are based on the most recent Mortgage that was taken out on this home.
Original Mortgage
$1,046,995
Outstanding Balance
$953,431
Interest Rate
3.14%
Mortgage Type
New Conventional
Estimated Equity
-$773,098
Purchase Details
Closed on
Nov 9, 2021
Sold by
The Sharon Holmes Llc
Bought by
Fgw Investment Properties Llc
Home Financials for this Owner
Home Financials are based on the most recent Mortgage that was taken out on this home.
Original Mortgage
$1,046,995
Outstanding Balance
$953,431
Interest Rate
3.14%
Mortgage Type
New Conventional
Estimated Equity
-$773,098
Purchase Details
Closed on
Aug 16, 2019
Sold by
Bryant Howard E and Bryant Stephen D
Bought by
The Sharon Holmes Llc
Purchase Details
Closed on
Oct 9, 2018
Sold by
Fgw Investments Properties Llc
Bought by
Bryant Howard E and Bryant Stephen D
Purchase Details
Closed on
Jan 23, 2018
Sold by
Brown Donald E
Bought by
F6w Investments Propertie Llc
Purchase Details
Closed on
Feb 8, 1982
Bought by
Reid Elizabeth O
Create a Home Valuation Report for This Property
The Home Valuation Report is an in-depth analysis detailing your home's value as well as a comparison with similar homes in the area
Home Values in the Area
Average Home Value in this Area
Purchase History
| Date | Buyer | Sale Price | Title Company |
|---|---|---|---|
| Fgw Investment Properties Llc | -- | Genesis Title | |
| Fgw Investment Properties Llc | -- | Genesis Title Agency Llc | |
| The Sharon Holmes Llc | -- | None Available | |
| Bryant Howard E | -- | None Available | |
| F6w Investments Propertie Llc | $12,000 | None Available | |
| Reid Elizabeth O | -- | -- |
Source: Public Records
Mortgage History
| Date | Status | Borrower | Loan Amount |
|---|---|---|---|
| Open | Fgw Investment Properties Llc | $1,046,995 | |
| Closed | Fgw Investment Properties Llc | $1,046,995 |
Source: Public Records
Tax History
| Year | Tax Paid | Tax Assessment Tax Assessment Total Assessment is a certain percentage of the fair market value that is determined by local assessors to be the total taxable value of land and additions on the property. | Land | Improvement |
|---|---|---|---|---|
| 2025 | $3,167 | $60,450 | $5,990 | $54,460 |
| 2024 | $3,167 | $60,450 | $5,990 | $54,460 |
| 2023 | $2,736 | $60,445 | $5,985 | $54,460 |
| 2022 | $2,767 | $44,700 | $2,000 | $42,700 |
| 2021 | $2,380 | $44,700 | $2,000 | $42,700 |
| 2020 | $983 | $15,620 | $2,000 | $13,620 |
| 2019 | $1,262 | $13,100 | $1,650 | $11,450 |
| 2018 | $865 | $13,100 | $1,650 | $11,450 |
| 2017 | $814 | $13,100 | $1,650 | $11,450 |
| 2016 | $1,006 | $14,810 | $4,060 | $10,750 |
| 2015 | $916 | $14,810 | $4,060 | $10,750 |
| 2014 | $918 | $14,810 | $4,060 | $10,750 |
| 2013 | $532 | $17,395 | $4,760 | $12,635 |
Source: Public Records
Map
Nearby Homes
- 329-331 Whitethorne Ave
- 265-267 Belvidere Ave
- 249 Midland Ave
- 244 Clarendon Ave
- 302 S Highland Ave Unit 306
- 2023 Sullivant Ave Unit 2025
- 196 Belvidere Ave
- 172 Whitethorne Ave
- 2009 Sullivant Ave Unit 9
- 485 Belvidere Ave
- 346 S Wheatland Ave
- 178 Belvidere Ave
- 225 S Highland Ave
- 341 S Wheatland Ave
- 307 S Wheatland Ave
- 530 Whitethorne Ave
- 510 Belvidere Ave
- 204 S Wheatland Ave
- 137 Clarendon Ave
- 1953 Sullivant Ave
- 329 Whitethorne Ave Unit 331
- 329 Whitethorne Ave Unit 31
- 321 Whitethorne Ave
- 315 Whitethorne Ave
- 309 Whitethorne Ave
- 343 Whitethorne Ave
- 326 Midland Ave Unit 328
- 330-332 Midland Ave
- 330 Midland Ave Unit 332
- 303 Whitethorne Ave
- 347 Whitethorne Ave
- 316 Midland Ave
- 320 Midland Ave
- 310 Midland Ave
- 344 Midland Ave
- 299 Whitethorne Ave
- 328 Whitethorne Ave
- 320 Whitethorne Ave
- 334 Whitethorne Ave
Your Personal Tour Guide
Ask me questions while you tour the home.