Estimated Value: $429,000 - $483,000
3
Beds
2
Baths
1,392
Sq Ft
$321/Sq Ft
Est. Value
About This Home
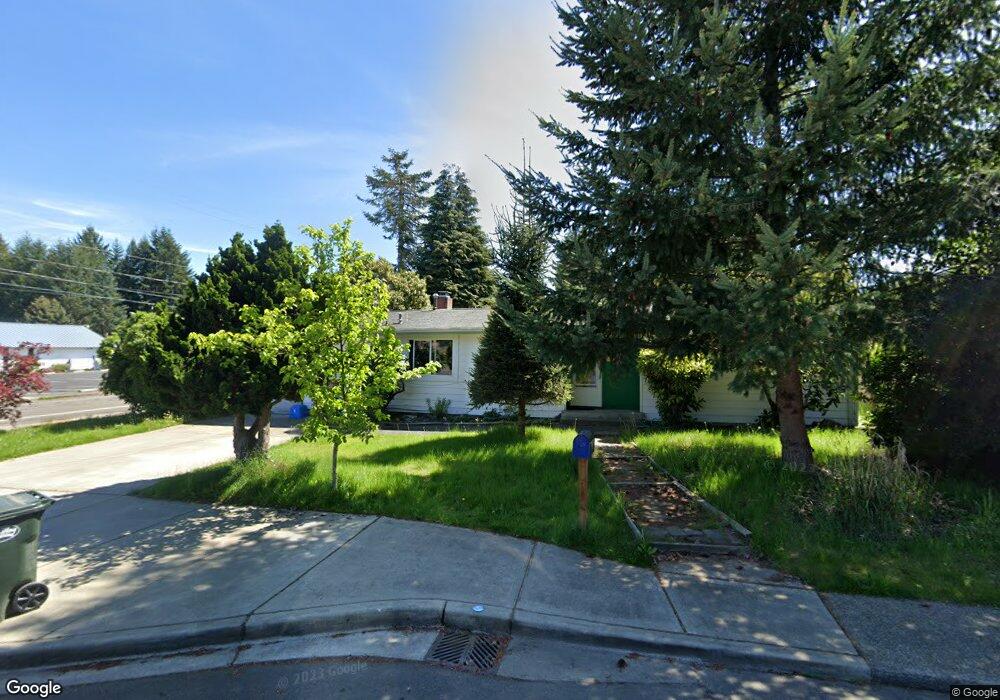
This home is located at 325 X St SE, Tumwater, WA 98501 and is currently estimated at $446,482, approximately $320 per square foot. 325 X St SE is a home located in Thurston County with nearby schools including Peter G. Schmidt Elementary School, George Washington Bush Middle School, and Tumwater High School.
Ownership History
Date
Name
Owned For
Owner Type
Purchase Details
Closed on
Jan 24, 2020
Sold by
Hoppe Jessica
Bought by
Hoppe Nathan
Current Estimated Value
Purchase Details
Closed on
May 13, 2008
Sold by
Wilkinson Christine K and Wilkinson Larry J
Bought by
Hoppe Nathan L and Hoppe Jessica
Home Financials for this Owner
Home Financials are based on the most recent Mortgage that was taken out on this home.
Original Mortgage
$230,400
Interest Rate
5.88%
Mortgage Type
VA
Purchase Details
Closed on
Sep 9, 1997
Sold by
Shave Wayne B and Shave Elizabeth
Bought by
Krueger Christine L
Home Financials for this Owner
Home Financials are based on the most recent Mortgage that was taken out on this home.
Original Mortgage
$97,850
Interest Rate
7.34%
Create a Home Valuation Report for This Property
The Home Valuation Report is an in-depth analysis detailing your home's value as well as a comparison with similar homes in the area
Home Values in the Area
Average Home Value in this Area
Purchase History
| Date | Buyer | Sale Price | Title Company |
|---|---|---|---|
| Hoppe Nathan | -- | None Available | |
| Hoppe Nathan L | $225,000 | Chicago Title Company | |
| Krueger Christine L | $103,000 | First American Title Ins Co |
Source: Public Records
Mortgage History
| Date | Status | Borrower | Loan Amount |
|---|---|---|---|
| Previous Owner | Hoppe Nathan L | $230,400 | |
| Previous Owner | Krueger Christine L | $97,850 |
Source: Public Records
Tax History Compared to Growth
Tax History
| Year | Tax Paid | Tax Assessment Tax Assessment Total Assessment is a certain percentage of the fair market value that is determined by local assessors to be the total taxable value of land and additions on the property. | Land | Improvement |
|---|---|---|---|---|
| 2024 | $3,556 | $384,000 | $158,800 | $225,200 |
| 2023 | $3,556 | $355,000 | $124,400 | $230,600 |
| 2022 | $3,562 | $377,300 | $99,100 | $278,200 |
| 2021 | $3,294 | $302,500 | $83,500 | $219,000 |
| 2020 | $3,041 | $256,500 | $84,200 | $172,300 |
| 2019 | $2,735 | $229,600 | $53,100 | $176,500 |
| 2018 | $2,632 | $203,800 | $41,600 | $162,200 |
| 2017 | $2,369 | $180,300 | $48,700 | $131,600 |
| 2016 | $2,269 | $169,500 | $54,200 | $115,300 |
| 2014 | -- | $166,400 | $54,200 | $112,200 |
Source: Public Records
Map
Nearby Homes
- 514 W St SE
- 6521 Huron Ln SE
- 534 Gilbertson Ln SE
- 6018 Silver Oaks Ct SE
- 6017 Capitol Blvd S
- 753 T St SE
- 261 65th Ct SW Unit 263
- 310 Y St SW
- 228 Lee St SE
- 301 Dennis St SW
- 716 Dennis St SE Unit 90
- 716 Dennis St SE Unit 35
- 132 & 129 Linda St SE
- 315 Dennis St SW
- 0 Bonniewood Dr SE
- 6636 Kyodi Ct SE
- 6823 Kyodi Ct SE
- 6808 Kyodi Ct SE
- 1104 68th (Lot 10) Loop SE
- 1107 Loop SE