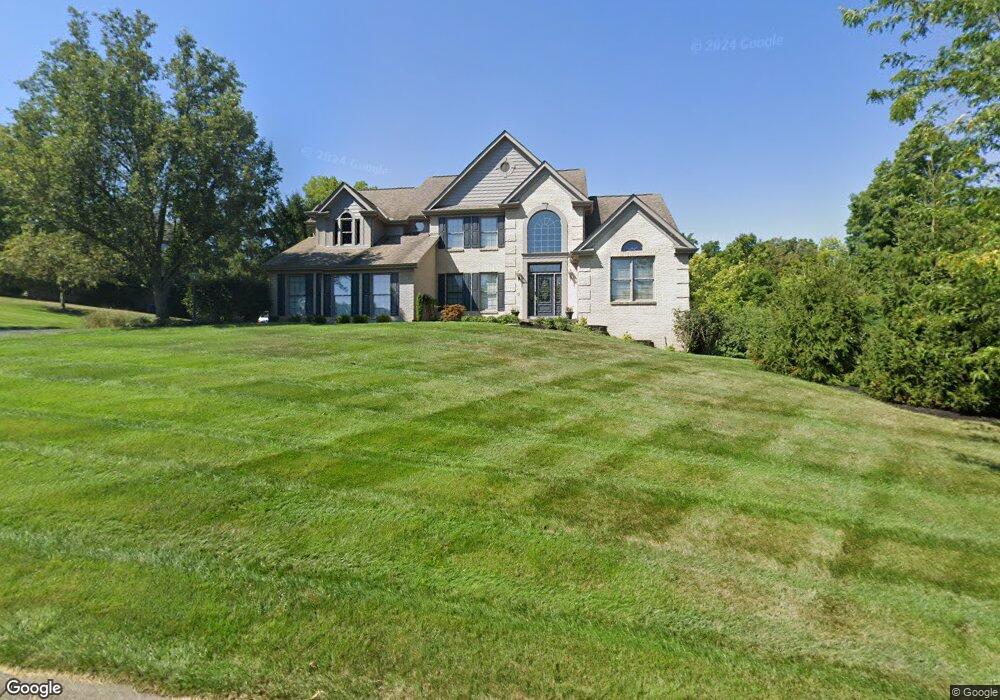
3251 Dry Run View Ln Cincinnati, OH 45244
Dry Run NeighborhoodEstimated Value: $840,000 - $1,079,000
4
Beds
5
Baths
4,607
Sq Ft
$206/Sq Ft
Est. Value
About This Home
This home is located at 3251 Dry Run View Ln, Cincinnati, OH 45244 and is currently estimated at $946,842, approximately $205 per square foot. 3251 Dry Run View Ln is a home located in Hamilton County with nearby schools including Mercer Elementary School, Nagel Middle School, and Turpin High School.
Ownership History
Date
Name
Owned For
Owner Type
Purchase Details
Closed on
Jun 26, 2002
Sold by
Fancher Sandra H and Fancher Don C
Bought by
Flowers Norman H and Flowers Trudy L
Current Estimated Value
Home Financials for this Owner
Home Financials are based on the most recent Mortgage that was taken out on this home.
Original Mortgage
$217,500
Outstanding Balance
$79,313
Interest Rate
4.75%
Estimated Equity
$867,529
Purchase Details
Closed on
Apr 22, 1998
Sold by
Fancher Sandra H and Fancher Don C
Bought by
Fancher Sandra H
Purchase Details
Closed on
Dec 17, 1996
Sold by
Orner Dan R
Bought by
Fancher Don C and Fancher Sandra H
Home Financials for this Owner
Home Financials are based on the most recent Mortgage that was taken out on this home.
Original Mortgage
$200,000
Interest Rate
7.66%
Create a Home Valuation Report for This Property
The Home Valuation Report is an in-depth analysis detailing your home's value as well as a comparison with similar homes in the area
Home Values in the Area
Average Home Value in this Area
Purchase History
| Date | Buyer | Sale Price | Title Company |
|---|---|---|---|
| Flowers Norman H | $517,500 | -- | |
| Fancher Sandra H | -- | -- | |
| Fancher Don C | -- | -- | |
| Orner Dan R | $412,000 | -- |
Source: Public Records
Mortgage History
| Date | Status | Borrower | Loan Amount |
|---|---|---|---|
| Open | Flowers Norman H | $217,500 | |
| Previous Owner | Fancher Don C | $200,000 |
Source: Public Records
Tax History Compared to Growth
Tax History
| Year | Tax Paid | Tax Assessment Tax Assessment Total Assessment is a certain percentage of the fair market value that is determined by local assessors to be the total taxable value of land and additions on the property. | Land | Improvement |
|---|---|---|---|---|
| 2024 | $12,073 | $198,752 | $31,210 | $167,542 |
| 2023 | $11,484 | $198,752 | $31,210 | $167,542 |
| 2022 | $10,770 | $165,995 | $31,833 | $134,162 |
| 2021 | $10,515 | $165,995 | $31,833 | $134,162 |
| 2020 | $10,636 | $165,995 | $31,833 | $134,162 |
| 2019 | $11,483 | $162,740 | $31,210 | $131,530 |
| 2018 | $10,756 | $162,740 | $31,210 | $131,530 |
| 2017 | $10,144 | $162,740 | $31,210 | $131,530 |
| 2016 | $10,800 | $169,306 | $33,513 | $135,793 |
| 2015 | $10,489 | $169,306 | $33,513 | $135,793 |
| 2014 | $10,496 | $169,306 | $33,513 | $135,793 |
| 2013 | $9,731 | $165,985 | $32,855 | $133,130 |
Source: Public Records
Map
Nearby Homes
- 3410 Oyster Bay Ct
- 3057 Fox Den Ln
- 8217 Wycliffe Dr
- 7267 English Dr
- 7247 Baltic Ct
- 8385 Bridle Rd
- 7160 English Dr Unit 2303
- 7124 Thorndale Ln
- 7050 Olentangy Ln
- 8108 Cabinet Cir
- 0 Pearl St Unit 1225343
- 0 Pearl St Unit 1841806
- 7481 Heatherwood Ln
- 7392 Hunley Rd
- 6809 Jefferson St
- 4669 Bluejacket Rd
- 7976 Ashley View Dr
- 4551 Dameron Ln
- 3975 Mount Carmel Rd
- 2193 Forestlake Dr
- 7720 Overlook Hills Ln
- 41 Overlook Hills Ln
- 3263 Dry Run View Ln
- 3263 Dry Run View Ln Unit 30
- 3250 Dry Run View Ln
- 3275 Dry Run View Ln
- 7721 Overlook Hills Ln
- 7700 Overlook Hills Ln
- 7660 Overlook Hills Ln
- 7760 Overlook Hills Ln
- 3230 Dry Run View Ln
- 3176 Williams Creek Dr
- 7630 Overlook Hills Ln
- 3280 Dry Run View Ln
- 7620 Overlook Hills Ln
- 3287 Dry Run View Ln
- 3216 Dry Run View Ln
- 3211 Dry Run View Ln
- 7762 Overlook Hills Ln
- 7645 Overlook Hills Ln