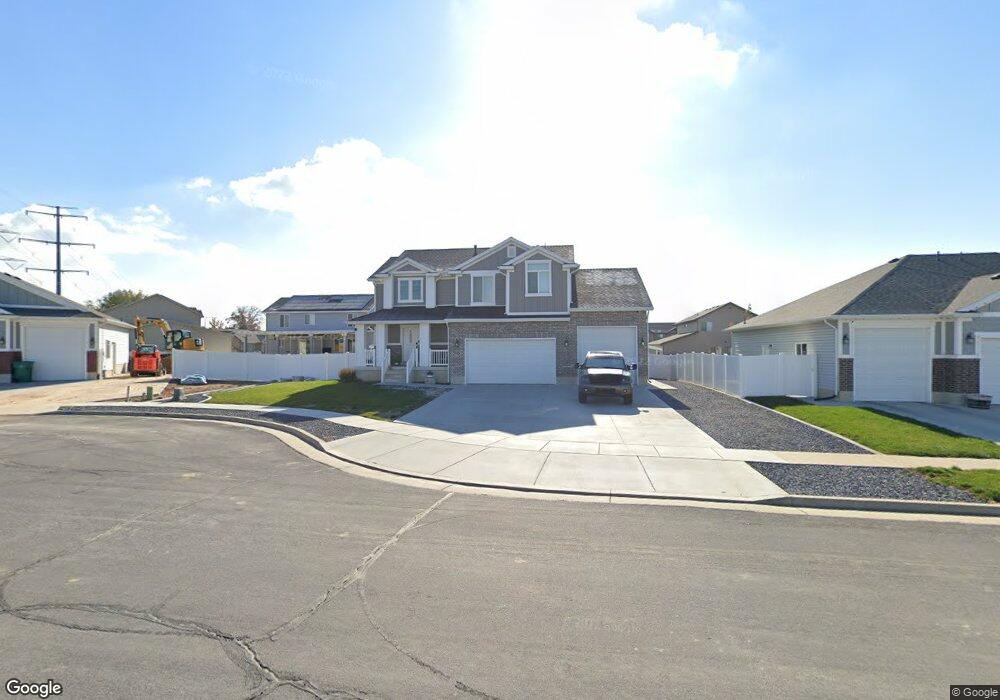
3251 W 1075 N Layton, UT 84041
Estimated Value: $627,000 - $674,000
4
Beds
3
Baths
3,133
Sq Ft
$207/Sq Ft
Est. Value
About This Home
This home is located at 3251 W 1075 N, Layton, UT 84041 and is currently estimated at $648,791, approximately $207 per square foot. 3251 W 1075 N is a home located in Davis County with nearby schools including Sand Springs Elementary School, Legacy Junior High School, and Layton High School.
Ownership History
Date
Name
Owned For
Owner Type
Purchase Details
Closed on
Aug 19, 2020
Sold by
Baker David and Baker Chelsea
Bought by
Gormley Paul and Gormley Jamie Sue
Current Estimated Value
Home Financials for this Owner
Home Financials are based on the most recent Mortgage that was taken out on this home.
Original Mortgage
$425,000
Outstanding Balance
$377,005
Interest Rate
3%
Mortgage Type
VA
Estimated Equity
$271,786
Purchase Details
Closed on
Apr 1, 2020
Sold by
Gwin Roy Myers and Gwin Amy F
Bought by
Baker David and Baker Chelsea
Home Financials for this Owner
Home Financials are based on the most recent Mortgage that was taken out on this home.
Original Mortgage
$411,350
Interest Rate
3.4%
Mortgage Type
New Conventional
Purchase Details
Closed on
Nov 15, 2016
Sold by
Gwin Roy Myers
Bought by
Gwin Roy Myers and Gwin Amy F
Create a Home Valuation Report for This Property
The Home Valuation Report is an in-depth analysis detailing your home's value as well as a comparison with similar homes in the area
Home Values in the Area
Average Home Value in this Area
Purchase History
| Date | Buyer | Sale Price | Title Company |
|---|---|---|---|
| Gormley Paul | -- | Backman Title Serv | |
| Baker David | -- | Backman Title Servic | |
| Gwin Roy Myers | -- | Mountain View Title | |
| Gwin Roy Myers | -- | Mountain View Title |
Source: Public Records
Mortgage History
| Date | Status | Borrower | Loan Amount |
|---|---|---|---|
| Open | Gormley Paul | $425,000 | |
| Previous Owner | Baker David | $411,350 |
Source: Public Records
Tax History Compared to Growth
Tax History
| Year | Tax Paid | Tax Assessment Tax Assessment Total Assessment is a certain percentage of the fair market value that is determined by local assessors to be the total taxable value of land and additions on the property. | Land | Improvement |
|---|---|---|---|---|
| 2025 | -- | $343,200 | $119,882 | $223,318 |
| 2024 | -- | $321,750 | $125,611 | $196,139 |
| 2023 | $896 | $556,000 | $125,669 | $430,331 |
| 2022 | $896 | $317,900 | $77,663 | $240,237 |
| 2021 | $331 | $451,000 | $116,514 | $334,486 |
| 2020 | $136 | $415,000 | $98,253 | $316,747 |
| 2019 | $371 | $392,000 | $100,366 | $291,634 |
| 2018 | $2,577 | $367,000 | $88,078 | $278,922 |
| 2016 | $862 | $63,326 | $63,326 | $0 |
| 2015 | $908 | $63,326 | $63,326 | $0 |
| 2014 | $888 | $63,326 | $63,326 | $0 |
| 2013 | -- | $52,640 | $52,640 | $0 |
Source: Public Records
Map
Nearby Homes