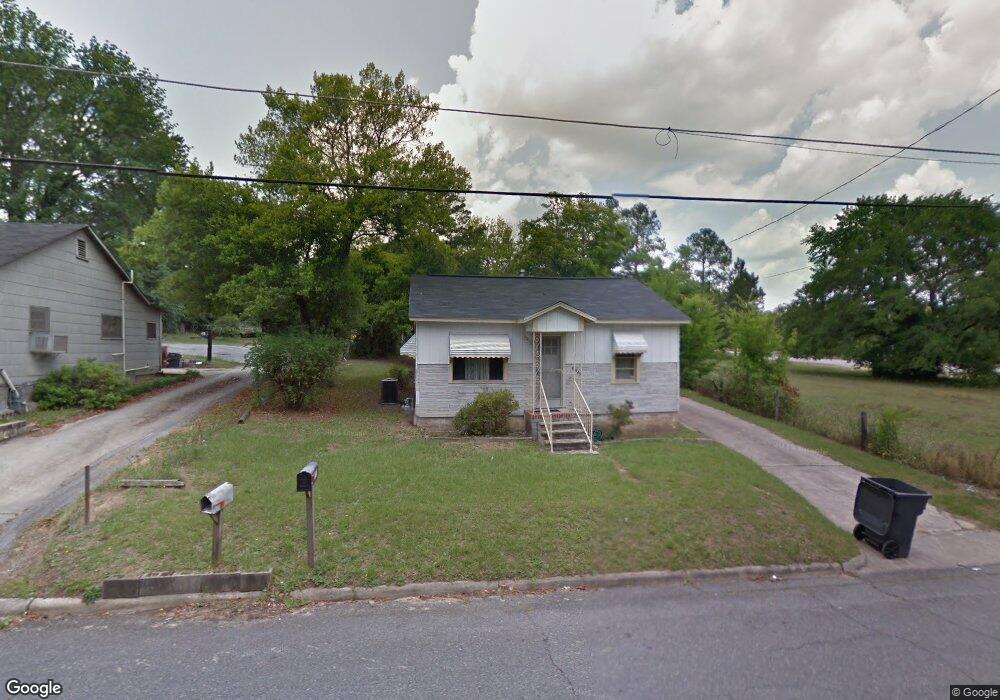
3252 Ruark Rd Macon, GA 31217
Estimated Value: $55,395 - $75,000
2
Beds
1
Bath
954
Sq Ft
$68/Sq Ft
Est. Value
About This Home
This home is located at 3252 Ruark Rd, Macon, GA 31217 and is currently estimated at $65,349, approximately $68 per square foot. 3252 Ruark Rd is a home located in Bibb County with nearby schools including Bernd Elementary School, Appling Middle School, and Northeast High School.
Ownership History
Date
Name
Owned For
Owner Type
Purchase Details
Closed on
May 14, 2021
Sold by
Stephens James H
Bought by
Fitzpatrick Deunte
Current Estimated Value
Purchase Details
Closed on
Dec 28, 2017
Sold by
Tinny Rosalyn and Tinning Ulepses
Bought by
Tely Patrich Deonte F
Purchase Details
Closed on
Jul 5, 2017
Sold by
Davis Jazmyne and Finney Ulyssess J
Bought by
Finney Ulysses J and Finney Rosalyn P
Purchase Details
Closed on
Nov 19, 2015
Sold by
Finney Ulysses J
Bought by
Davis Jazmyne
Home Financials for this Owner
Home Financials are based on the most recent Mortgage that was taken out on this home.
Original Mortgage
$16,800
Interest Rate
3.83%
Mortgage Type
New Conventional
Purchase Details
Closed on
Nov 15, 1995
Sold by
Price Ira Frank
Bought by
Finney Ulysses J - Rosalyn P
Create a Home Valuation Report for This Property
The Home Valuation Report is an in-depth analysis detailing your home's value as well as a comparison with similar homes in the area
Purchase History
| Date | Buyer | Sale Price | Title Company |
|---|---|---|---|
| Fitzpatrick Deunte | $16,800 | None Available | |
| Tely Patrich Deonte F | -- | None Available | |
| Finney Ulysses J | $12,000 | None Available | |
| Davis Jazmyne | $19,000 | -- | |
| Finney Ulysses J - Rosalyn P | $18,000 | -- |
Source: Public Records
Mortgage History
| Date | Status | Borrower | Loan Amount |
|---|---|---|---|
| Previous Owner | Davis Jazmyne | $16,800 |
Source: Public Records
Tax History
| Year | Tax Paid | Tax Assessment Tax Assessment Total Assessment is a certain percentage of the fair market value that is determined by local assessors to be the total taxable value of land and additions on the property. | Land | Improvement |
|---|---|---|---|---|
| 2025 | $377 | $15,357 | $1,040 | $14,317 |
| 2024 | $390 | $15,357 | $1,040 | $14,317 |
| 2023 | $390 | $15,357 | $1,040 | $14,317 |
| 2022 | $309 | $8,923 | $1,113 | $7,810 |
| 2021 | $339 | $8,923 | $1,113 | $7,810 |
| 2020 | $346 | $8,923 | $1,113 | $7,810 |
| 2019 | $381 | $9,745 | $1,113 | $8,632 |
| 2018 | $764 | $9,745 | $1,113 | $8,632 |
| 2017 | $365 | $9,745 | $1,113 | $8,632 |
| 2016 | $263 | $9,744 | $1,113 | $8,632 |
| 2015 | $477 | $9,744 | $1,113 | $8,632 |
| 2014 | $159 | $9,744 | $1,113 | $8,632 |
Source: Public Records
Map
Nearby Homes
- 3552 Jeffersonville Rd
- 3784 Finneydale Dr
- 3560 Jeffersonville Rd
- 3444 Mogul Rd
- 3616 Jeffersonville Rd
- 3451 Finneydale Dr
- 3982 Kings Park Cir
- 3688 Jessica Dr
- 3426 Lancing Ct
- 3348 Kings Park Cir
- 3320 Riggins Mill Rd
- 3320 Jones Dr
- 3335 Esther Dr
- 3533 Windsor Cir
- 3743 Hitchcock Rd
- 3587 Windsor Cir
- 3490 Lancing Ct
- 3835 Kings Park Cir
- 3830 Brenda Dr
- 3330 E Royal Ct
- 3244 Ruark Rd
- 3238 Ruark Rd
- 3381 Jeffersonville Rd
- 3397 Jeffersonville Rd
- 3241 Ruark Rd
- 3249 Ruark Rd
- 3230 Ruark Rd
- 3371 Jeffersonville Rd
- 3411 Jeffersonville Rd
- 3242 Darity Dr
- 3235 Ruark Rd
- 3222 Ruark Rd
- 3221 Ruark Rd
- 3237 Darity Dr
- 3421 Jeffersonville Rd
- 3412 Jeffersonville Rd
- 3210 Ruark Rd
- 3215 Ruark Rd
- 3207 Ruark Rd
- 3333 Jeffersonville Rd
Your Personal Tour Guide
Ask me questions while you tour the home.