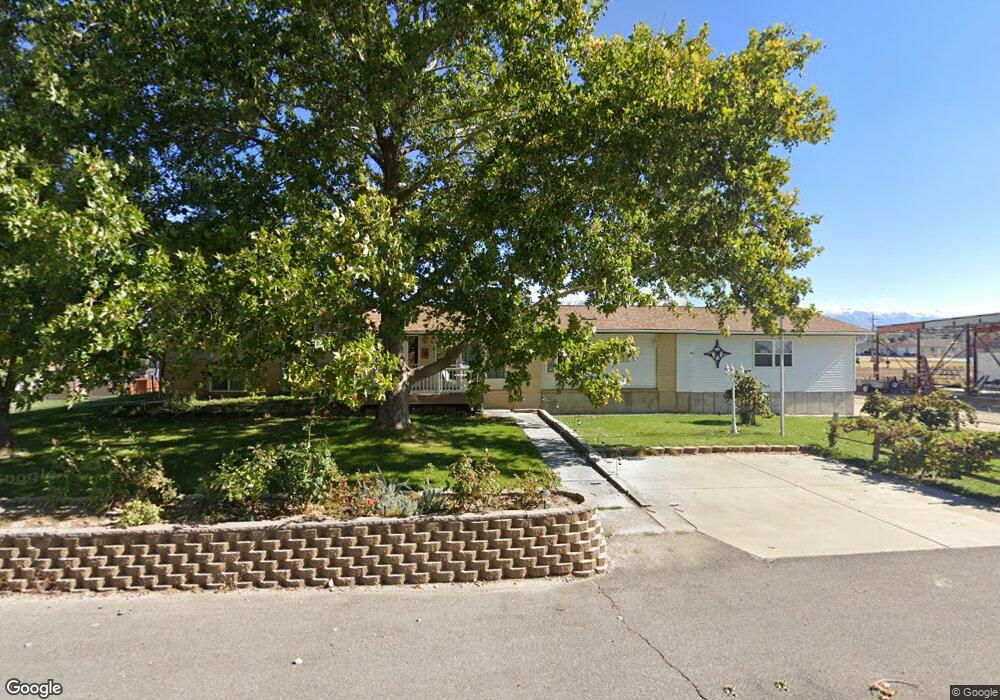
3252 S 2850 W West Haven, UT 84401
Estimated Value: $561,000 - $664,000
4
Beds
3
Baths
1,760
Sq Ft
$356/Sq Ft
Est. Value
About This Home
This home is located at 3252 S 2850 W, West Haven, UT 84401 and is currently estimated at $626,728, approximately $356 per square foot. 3252 S 2850 W is a home located in Weber County with nearby schools including Kanesville Elementary School, Rocky Mountain Junior High School, and Fremont High School.
Ownership History
Date
Name
Owned For
Owner Type
Purchase Details
Closed on
May 20, 2022
Sold by
Ryan D Williams Living Trust
Bought by
Williams Ryan D and Williams Melinda
Current Estimated Value
Purchase Details
Closed on
May 19, 2022
Sold by
Williams Ryan D
Bought by
Ryan D Williams And Melinda Williams Living T
Purchase Details
Closed on
Apr 12, 2017
Sold by
Williams Ryan D and Williams Melinda D
Bought by
Williams Ryan D and Williams Melinda
Purchase Details
Closed on
Sep 22, 1998
Sold by
Williams Ryan D and Maiello Melinda D
Bought by
Williams Ryan D and Williams Melinda D
Home Financials for this Owner
Home Financials are based on the most recent Mortgage that was taken out on this home.
Original Mortgage
$85,000
Interest Rate
6.88%
Create a Home Valuation Report for This Property
The Home Valuation Report is an in-depth analysis detailing your home's value as well as a comparison with similar homes in the area
Home Values in the Area
Average Home Value in this Area
Purchase History
| Date | Buyer | Sale Price | Title Company |
|---|---|---|---|
| Williams Ryan D | -- | None Listed On Document | |
| Ryan D Williams And Melinda Williams Living T | -- | None Listed On Document | |
| Williams Ryan D | -- | None Available | |
| Williams Ryan D | -- | -- |
Source: Public Records
Mortgage History
| Date | Status | Borrower | Loan Amount |
|---|---|---|---|
| Previous Owner | Williams Ryan D | $85,000 |
Source: Public Records
Tax History Compared to Growth
Tax History
| Year | Tax Paid | Tax Assessment Tax Assessment Total Assessment is a certain percentage of the fair market value that is determined by local assessors to be the total taxable value of land and additions on the property. | Land | Improvement |
|---|---|---|---|---|
| 2025 | $4,514 | $616,317 | $193,227 | $423,090 |
| 2024 | $4,223 | $354,001 | $113,204 | $240,797 |
| 2023 | $4,229 | $360,623 | $95,504 | $265,119 |
| 2022 | $4,345 | $360,250 | $88,931 | $271,319 |
| 2021 | $3,689 | $497,000 | $93,600 | $403,400 |
| 2020 | $3,388 | $429,999 | $83,600 | $346,399 |
| 2019 | $3,181 | $387,000 | $82,400 | $304,600 |
| 2018 | $3,218 | $385,000 | $82,400 | $302,600 |
| 2017 | $2,737 | $308,000 | $78,600 | $229,400 |
| 2016 | $2,564 | $174,068 | $36,850 | $137,218 |
| 2015 | $2,103 | $138,260 | $36,850 | $101,410 |
| 2014 | $1,946 | $125,806 | $36,850 | $88,956 |
Source: Public Records
Map
Nearby Homes
- 2637 W 3125 S
- 3140 S Straight St
- 2448 W Anne Ave
- 3444 S 3100 W Unit 154
- 3243 S 2400 W
- 3452 S 3100 W Unit 152
- 2837 W 2875 S
- 2383 W 3225 S
- 2869 S 2700 W
- 2459 W Glover Ln
- 3179 W 3200 S
- 3148 W 3450 S Unit 160
- 2351 James Way Unit F23
- 2354 Leigh Ln Unit G26-27
- 3156 W 3450 St S Unit 161
- 3165 W 3475 S Unit 167
- 3155 W St Unit 168
- 2340 W 3225 S
- 2373 W Howard St
- 3419 S Erin Ave