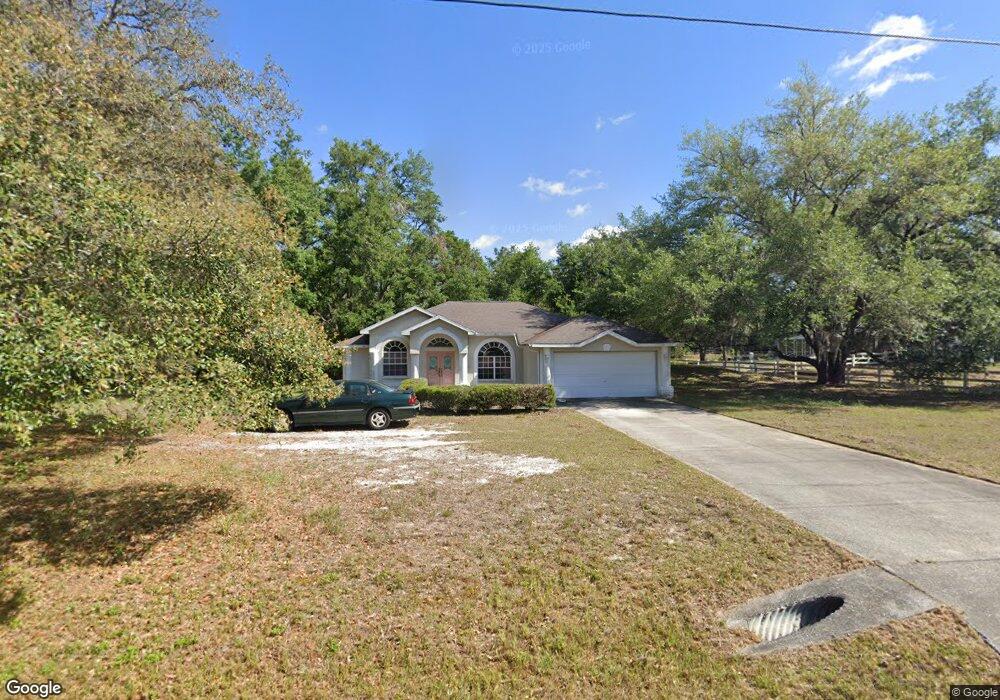
32529 Greenwood Loop Wesley Chapel, FL 33545
Estimated Value: $229,000 - $495,000
--
Bed
2
Baths
1,643
Sq Ft
$194/Sq Ft
Est. Value
About This Home
This home is located at 32529 Greenwood Loop, Wesley Chapel, FL 33545 and is currently estimated at $318,087, approximately $193 per square foot. 32529 Greenwood Loop is a home located in Pasco County with nearby schools including Watergrass Elementary School, Thomas E. Weightman Middle School, and Wesley Chapel High School.
Ownership History
Date
Name
Owned For
Owner Type
Purchase Details
Closed on
Jun 25, 2025
Sold by
Festag Richard
Bought by
Davis Greg and Davis Angela
Current Estimated Value
Home Financials for this Owner
Home Financials are based on the most recent Mortgage that was taken out on this home.
Original Mortgage
$212,500
Outstanding Balance
$211,637
Interest Rate
2%
Mortgage Type
Seller Take Back
Estimated Equity
$106,450
Purchase Details
Closed on
May 19, 2025
Sold by
Festag Richard A
Bought by
Festag Richard A and Huebner Marilyn J
Home Financials for this Owner
Home Financials are based on the most recent Mortgage that was taken out on this home.
Original Mortgage
$212,500
Outstanding Balance
$211,637
Interest Rate
2%
Mortgage Type
Seller Take Back
Estimated Equity
$106,450
Purchase Details
Closed on
Apr 2, 1998
Sold by
William and Boyd Carol
Bought by
Festag Richard A and Festag Albina
Create a Home Valuation Report for This Property
The Home Valuation Report is an in-depth analysis detailing your home's value as well as a comparison with similar homes in the area
Home Values in the Area
Average Home Value in this Area
Purchase History
| Date | Buyer | Sale Price | Title Company |
|---|---|---|---|
| Davis Greg | $230,000 | Meridian Title | |
| Davis Greg | $230,000 | Meridian Title | |
| Festag Richard A | -- | None Listed On Document | |
| Festag Richard A | -- | None Listed On Document | |
| Festag Richard A | $19,000 | -- |
Source: Public Records
Mortgage History
| Date | Status | Borrower | Loan Amount |
|---|---|---|---|
| Open | Davis Greg | $212,500 | |
| Closed | Davis Greg | $212,500 |
Source: Public Records
Tax History Compared to Growth
Tax History
| Year | Tax Paid | Tax Assessment Tax Assessment Total Assessment is a certain percentage of the fair market value that is determined by local assessors to be the total taxable value of land and additions on the property. | Land | Improvement |
|---|---|---|---|---|
| 2025 | $1,808 | $139,340 | -- | -- |
| 2024 | $1,808 | $135,420 | -- | -- |
| 2023 | $1,731 | $131,480 | $48,867 | $82,613 |
| 2022 | $1,544 | $127,650 | $0 | $0 |
| 2021 | $1,505 | $123,940 | $36,644 | $87,296 |
| 2020 | $1,474 | $122,230 | $36,644 | $85,586 |
| 2019 | $1,440 | $119,490 | $0 | $0 |
| 2018 | $1,406 | $117,271 | $0 | $0 |
| 2017 | $1,395 | $117,271 | $0 | $0 |
| 2016 | $1,335 | $112,497 | $0 | $0 |
| 2015 | $1,352 | $111,715 | $0 | $0 |
| 2014 | $1,311 | $127,905 | $32,144 | $95,761 |
Source: Public Records
Map
Nearby Homes
- 32524 Greenwood Loop
- 32901 Knollwood Ln
- 9324 Rally Spring Loop
- 9293 Rally Spring Loop
- 9397 Ibis Grove Blvd
- 9107 Rally Spring Loop
- 9600 Ibis Grove Blvd
- 9018 Rally Spring Loop
- 9935 Allendale St
- 9947 Allendale St
- 9965 Allendale St
- 9962 Allendale St
- 9989 Allendale St
- 9983 Allendale St
- 32927 Marcia Ave
- Atlanta Plan at Twinflowers - The Manors
- Hartford Plan at Twinflowers - The Estates
- Annapolis Plan at Twinflowers - The Manors
- Raleigh Plan at Twinflowers - The Estates
- Boston Plan at Twinflowers - The Manors
- 32533 Greenwood Loop
- 32528 Greenwood Loop
- 32525 Greenwood Loop
- 32573 Greenwood Loop
- 32549 Greenwood Loop
- 32569 Greenwood Loop
- 32577 Greenwood Loop
- 32532 Greenwood Loop
- 32581 Greenwood Loop
- 32536 Greenwood Loop
- 32565 Greenwood Loop
- 32520 Greenwood Loop
- 32552 Greenwood Loop
- 32585 Greenwood Loop
- 32540 Greenwood Loop
- 32818 Peach Tree Ln
- 32572 Greenwood Loop
- 32513 Greenwood Loop
- 32516 Greenwood Loop
- 32548 Greenwood Loop