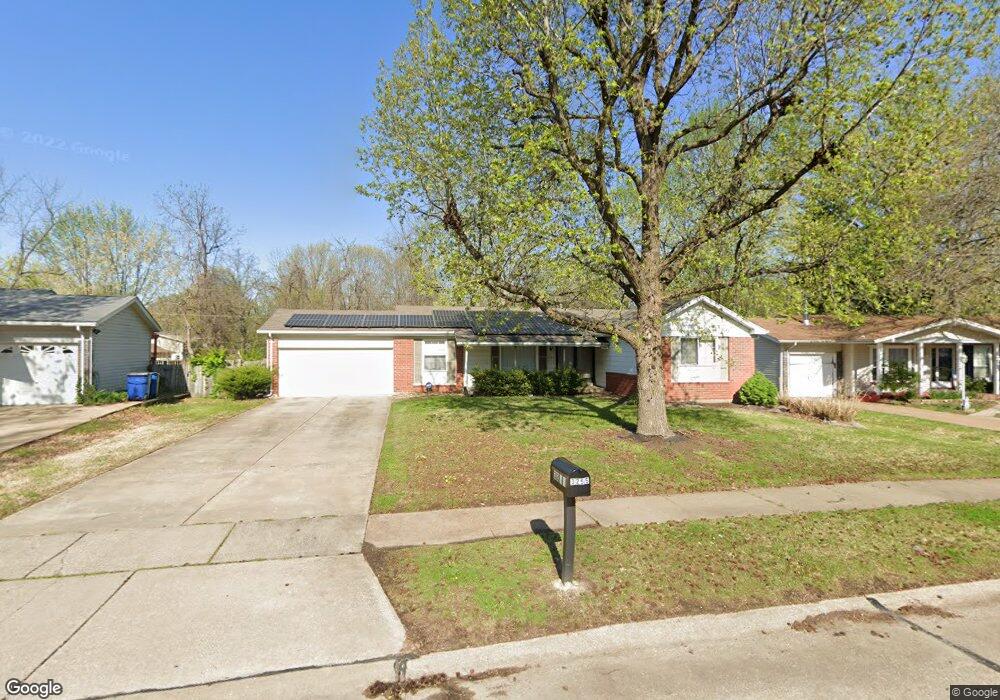
3255 Brookshire Dr Florissant, MO 63033
Estimated Value: $207,000 - $252,000
4
Beds
2
Baths
1,560
Sq Ft
$144/Sq Ft
Est. Value
About This Home
This home is located at 3255 Brookshire Dr, Florissant, MO 63033 and is currently estimated at $224,279, approximately $143 per square foot. 3255 Brookshire Dr is a home located in St. Louis County with nearby schools including Wedgwood Elementary School, Cross Keys Middle School, and McCluer North High School.
Ownership History
Date
Name
Owned For
Owner Type
Purchase Details
Closed on
Aug 23, 2011
Sold by
Chambers Roosevelt
Bought by
Carey Daniel A and Miller Steven J
Current Estimated Value
Home Financials for this Owner
Home Financials are based on the most recent Mortgage that was taken out on this home.
Original Mortgage
$110,622
Outstanding Balance
$75,875
Interest Rate
4.37%
Mortgage Type
FHA
Estimated Equity
$148,404
Purchase Details
Closed on
Mar 25, 2011
Sold by
Homesales Inc
Bought by
Chambers Roosevelt
Purchase Details
Closed on
Sep 29, 2010
Sold by
Taylor Robert M and Taylor Robert
Bought by
Homesales Of Delaware Inc
Purchase Details
Closed on
Nov 23, 2004
Sold by
Coy Georgia C
Bought by
Taylor Robert
Home Financials for this Owner
Home Financials are based on the most recent Mortgage that was taken out on this home.
Original Mortgage
$98,500
Interest Rate
6.8%
Mortgage Type
Purchase Money Mortgage
Create a Home Valuation Report for This Property
The Home Valuation Report is an in-depth analysis detailing your home's value as well as a comparison with similar homes in the area
Home Values in the Area
Average Home Value in this Area
Purchase History
| Date | Buyer | Sale Price | Title Company |
|---|---|---|---|
| Carey Daniel A | $113,500 | Investors Title Co Clayton | |
| Chambers Roosevelt | $49,000 | None Available | |
| Homesales Of Delaware Inc | $75,260 | None Available | |
| Taylor Robert | -- | -- |
Source: Public Records
Mortgage History
| Date | Status | Borrower | Loan Amount |
|---|---|---|---|
| Open | Carey Daniel A | $110,622 | |
| Previous Owner | Taylor Robert | $98,500 |
Source: Public Records
Tax History Compared to Growth
Tax History
| Year | Tax Paid | Tax Assessment Tax Assessment Total Assessment is a certain percentage of the fair market value that is determined by local assessors to be the total taxable value of land and additions on the property. | Land | Improvement |
|---|---|---|---|---|
| 2025 | $2,487 | $35,910 | $3,760 | $32,150 |
| 2024 | $2,487 | $32,990 | $3,270 | $29,720 |
| 2023 | $2,478 | $32,990 | $3,270 | $29,720 |
| 2022 | $2,273 | $26,560 | $3,270 | $23,290 |
| 2021 | $2,265 | $26,560 | $3,270 | $23,290 |
| 2020 | $1,767 | $19,210 | $3,760 | $15,450 |
| 2019 | $1,733 | $19,210 | $3,760 | $15,450 |
| 2018 | $1,942 | $19,270 | $2,950 | $16,320 |
| 2017 | $1,931 | $19,270 | $2,950 | $16,320 |
| 2016 | $1,663 | $16,130 | $2,600 | $13,530 |
| 2015 | $1,672 | $16,130 | $2,600 | $13,530 |
| 2014 | $2,157 | $21,570 | $4,810 | $16,760 |
Source: Public Records
Map
Nearby Homes
- 3370 Suncrest Dr
- 2525 Wedgwood Dr W
- 6 Willow Creek Estates Ct
- 2980 Wellington Dr
- 2756 Aberdeen Dr
- 15467 Jost Main St
- 2953 New Castle Dr
- 15412 Forte de France Ln
- 2036 Retford Dr
- 549 Rancho Ln
- 644 Shadow Rock Dr
- 1993 Greenheath Dr
- 519 Greenway Chase Ct
- 2701 Wellington Dr
- 425 Jana Dr
- 2750 Robert Dr
- 733 Mediterranean Dr
- 3914 Birkemeier Dr
- 2433 Lavin Ct
- 2932 Sherwood Dr
- 3235 Brookshire Dr
- 3275 Brookshire Dr
- 3295 Brookshire Dr
- 3225 Brookshire Dr
- 3260 Brookshire Dr
- 3280 Brookshire Dr
- 3240 Brookshire Dr
- 3325 Brookshire Dr
- 3220 Brookshire Dr
- 3215 Brookshire Dr
- 3320 Brookshire Dr
- 3240 Wellington Dr
- 3335 Brookshire Dr
- 2415 Cambridge Dr
- 3230 Wellington Dr
- 3205 Brookshire Dr
- 2470 Yorkshire Dr
- 2450 Yorkshire Dr
- 2490 Yorkshire Dr
- 2430 Yorkshire Dr