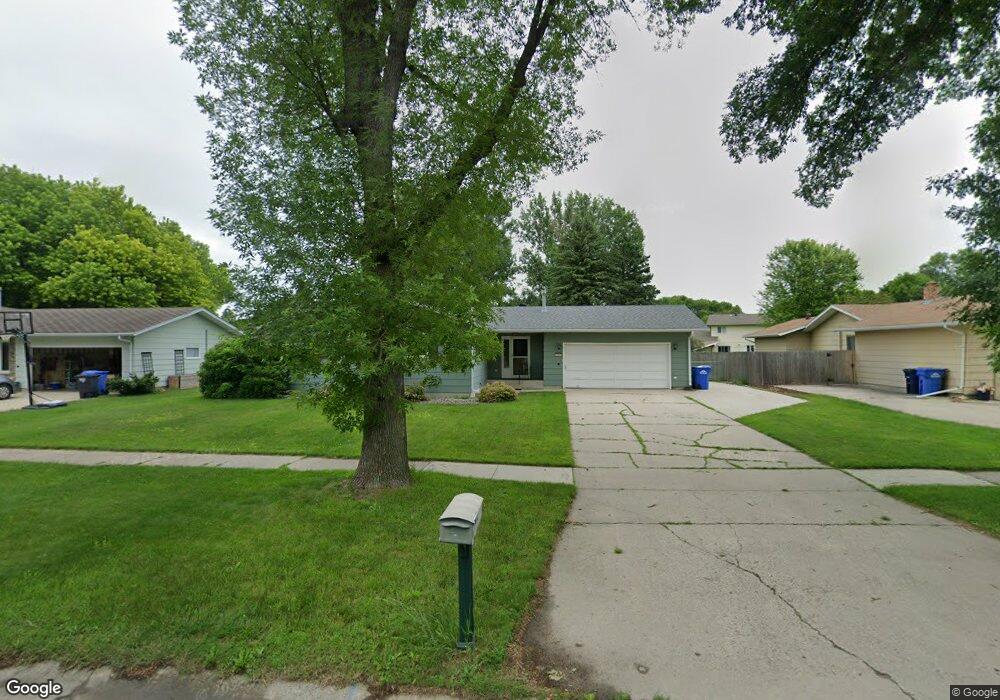
3255 Elm St N Fargo, ND 58102
Longfellow NeighborhoodEstimated Value: $316,000 - $351,000
3
Beds
2
Baths
1,210
Sq Ft
$277/Sq Ft
Est. Value
About This Home
This home is located at 3255 Elm St N, Fargo, ND 58102 and is currently estimated at $335,505, approximately $277 per square foot. 3255 Elm St N is a home located in Cass County with nearby schools including Longfellow Elementary School, Ben Franklin Middle School, and North High School.
Ownership History
Date
Name
Owned For
Owner Type
Purchase Details
Closed on
Jun 2, 2023
Sold by
Skiple Family Revocable Living Trust and Skiple Jason E
Bought by
John Laura L and John Jacob R
Current Estimated Value
Home Financials for this Owner
Home Financials are based on the most recent Mortgage that was taken out on this home.
Original Mortgage
$289,750
Outstanding Balance
$281,383
Interest Rate
6.39%
Mortgage Type
New Conventional
Estimated Equity
$54,122
Purchase Details
Closed on
Mar 24, 2022
Sold by
Skiple Jason E and Skiple Anita M
Bought by
Skiple Family Revocable Living Trust
Purchase Details
Closed on
Sep 6, 2006
Sold by
Dougherty Carleton L
Bought by
Skiple Jason E and Skiple Anita
Home Financials for this Owner
Home Financials are based on the most recent Mortgage that was taken out on this home.
Original Mortgage
$148,500
Interest Rate
6.77%
Mortgage Type
New Conventional
Create a Home Valuation Report for This Property
The Home Valuation Report is an in-depth analysis detailing your home's value as well as a comparison with similar homes in the area
Home Values in the Area
Average Home Value in this Area
Purchase History
| Date | Buyer | Sale Price | Title Company |
|---|---|---|---|
| John Laura L | $305,000 | Plains Title | |
| Skiple Family Revocable Living Trust | -- | None Listed On Document | |
| Skiple Jason E | -- | -- |
Source: Public Records
Mortgage History
| Date | Status | Borrower | Loan Amount |
|---|---|---|---|
| Open | John Laura L | $289,750 | |
| Previous Owner | Skiple Jason E | $148,500 |
Source: Public Records
Tax History Compared to Growth
Tax History
| Year | Tax Paid | Tax Assessment Tax Assessment Total Assessment is a certain percentage of the fair market value that is determined by local assessors to be the total taxable value of land and additions on the property. | Land | Improvement |
|---|---|---|---|---|
| 2024 | $3,807 | $152,950 | $40,800 | $112,150 |
| 2023 | $4,090 | $145,650 | $40,800 | $104,850 |
| 2022 | $3,795 | $132,400 | $40,800 | $91,600 |
| 2021 | $3,321 | $123,750 | $40,800 | $82,950 |
| 2020 | $3,122 | $117,850 | $40,800 | $77,050 |
| 2019 | $3,125 | $117,850 | $25,500 | $92,350 |
| 2018 | $2,855 | $109,000 | $25,500 | $83,500 |
| 2017 | $2,570 | $99,100 | $25,500 | $73,600 |
| 2016 | $2,147 | $90,100 | $25,500 | $64,600 |
| 2015 | $2,288 | $90,100 | $17,350 | $72,750 |
| 2014 | $2,552 | $98,100 | $17,350 | $80,750 |
| 2013 | $2,255 | $86,500 | $17,350 | $69,150 |
Source: Public Records
Map
Nearby Homes
- 21 35th Ave NE
- 3531 1st St N
- 3306 2nd St N Unit D26
- 108 32nd Ave N
- 3217 Cherry Ln N
- 3513 Par St N
- 3667 Evergreen Rd N
- 2937 Edgewood Dr N
- 2925 Edgewood Dr N
- 2939 Maple St N
- 2926 Edgewood Dr N
- 801 32nd Ave N Unit A102
- 2902 3rd St N
- 87 28th Ave N
- 3129 8th St N
- 3113 8th St N
- 501 Forest Ave N Unit C
- 2807 Edgewood Dr N
- 101 27th Ave N
- 310 27th Ave N
- 3249 Elm St N
- 3301 Elm St N
- 3250 Evergreen Cir N
- 3243 Elm St N
- 3256 Evergreen Cir N
- 3302 Elm St N
- 3308 Elm St N
- 3252 Elm St N
- 3244 Evergreen Cir N
- 3237 Elm St N
- 3401 Elm St N
- 3402 Elm St N
- 3246 Elm St N
- 17 35th Ave NE
- 72 35th Ave N
- 3262 Evergreen Cir N
- 3238 Evergreen Cir N
- 3238 Evergreen Rd N
- 3240 Elm St N
- 1 35th Ave NE