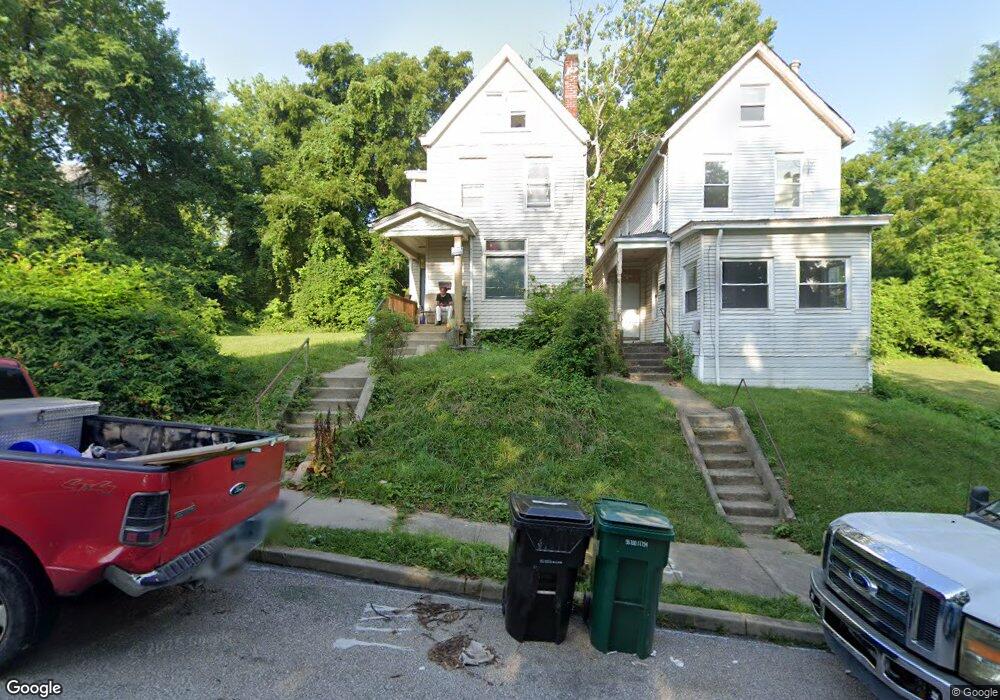
3255 Gaff Ave Cincinnati, OH 45206
Walnut Hills NeighborhoodEstimated Value: $129,000 - $158,427
5
Beds
1
Bath
1,272
Sq Ft
$117/Sq Ft
Est. Value
About This Home
This home is located at 3255 Gaff Ave, Cincinnati, OH 45206 and is currently estimated at $149,357, approximately $117 per square foot. 3255 Gaff Ave is a home located in Hamilton County with nearby schools including Frederick Douglass Elementary School, Robert A. Taft Information Technology High School, and Clark Montessori High School.
Ownership History
Date
Name
Owned For
Owner Type
Purchase Details
Closed on
Sep 26, 2013
Sold by
Burton Matthew F and Ichikawa Burton Sanae
Bought by
Mfb Properties Llc
Current Estimated Value
Purchase Details
Closed on
Feb 21, 2006
Sold by
Jp Morgan Chase Bank
Bought by
Burton Matthew F
Purchase Details
Closed on
Jun 20, 2005
Sold by
Frazier Jerry
Bought by
Jpmorgan Chase Bank
Purchase Details
Closed on
May 2, 2002
Sold by
Sterling Titus
Bought by
Frazier Jerry
Home Financials for this Owner
Home Financials are based on the most recent Mortgage that was taken out on this home.
Original Mortgage
$86,400
Interest Rate
7.85%
Purchase Details
Closed on
Mar 30, 2000
Sold by
Cook Gary
Bought by
Titus Sterling
Home Financials for this Owner
Home Financials are based on the most recent Mortgage that was taken out on this home.
Original Mortgage
$78,000
Interest Rate
8.18%
Purchase Details
Closed on
Jan 7, 2000
Sold by
Southern Baptist Ch Inc
Bought by
Cook Gary
Create a Home Valuation Report for This Property
The Home Valuation Report is an in-depth analysis detailing your home's value as well as a comparison with similar homes in the area
Home Values in the Area
Average Home Value in this Area
Purchase History
| Date | Buyer | Sale Price | Title Company |
|---|---|---|---|
| Mfb Properties Llc | -- | Attorney | |
| Burton Matthew F | $22,000 | Nova Title Agency Inc | |
| Jpmorgan Chase Bank | $34,000 | None Available | |
| Frazier Jerry | $75,700 | -- | |
| Titus Sterling | $17,500 | -- | |
| Cook Gary | $17,500 | -- |
Source: Public Records
Mortgage History
| Date | Status | Borrower | Loan Amount |
|---|---|---|---|
| Previous Owner | Frazier Jerry | $86,400 | |
| Previous Owner | Titus Sterling | $78,000 |
Source: Public Records
Tax History Compared to Growth
Tax History
| Year | Tax Paid | Tax Assessment Tax Assessment Total Assessment is a certain percentage of the fair market value that is determined by local assessors to be the total taxable value of land and additions on the property. | Land | Improvement |
|---|---|---|---|---|
| 2024 | $1,819 | $28,669 | $4,372 | $24,297 |
| 2023 | $2,015 | $31,707 | $4,372 | $27,335 |
| 2022 | $901 | $12,702 | $2,622 | $10,080 |
| 2021 | $884 | $12,702 | $2,622 | $10,080 |
| 2020 | $887 | $12,702 | $2,622 | $10,080 |
| 2019 | $812 | $10,584 | $2,184 | $8,400 |
| 2018 | $813 | $10,584 | $2,184 | $8,400 |
| 2017 | $782 | $10,584 | $2,184 | $8,400 |
| 2016 | $909 | $12,002 | $2,188 | $9,814 |
| 2015 | $813 | $12,002 | $2,188 | $9,814 |
| 2014 | $817 | $12,002 | $2,188 | $9,814 |
| 2013 | $847 | $12,247 | $2,233 | $10,014 |
Source: Public Records
Map
Nearby Homes
- 3219 Beresford Ave
- 3048 Gilbert Ave
- 3025 Gilbert Ave
- 3206 Gilbert Ave
- 3079 Kerper Ave
- 1537 Dixmont Ave
- 1521 Blair Ave
- 3144 Durrell Ave
- 1517 Saint Leger Place
- 3217 Gilbert Ave
- 1545 Ruth Ave
- 1541 Blair Ave
- 3409 Fernside Place
- 3238 Gilbert Ave
- 3121 Harvard Ave
- 3136 Harvard Ave
- 3319 Milton Ct
- 871 Hutchins Ave
- 3427 Woodburn Ave
- 855 Rockdale Ave
- 3257 Gaff Ave
- 3259 Gaff Ave
- 3263 Gaff Ave
- 3141 Gaff Ave
- 3143 Gaff Ave
- 3137 Gaff Ave
- 3252 Beresford Ave
- 3258 Beresford Ave
- 3256 Beresford Ave
- 3258 Gaff Ave
- 3250 Gaff Ave
- 3256 Gaff Ave
- 3246 Beresford Ave
- 3266 Beresford Ave
- 3273 Gaff Ave
- 3246 Gaff Ave
- 3244 Gaff Ave
- 3270 Beresford Ave
- 3275 Gaff Ave
- 3242 Gaff Ave