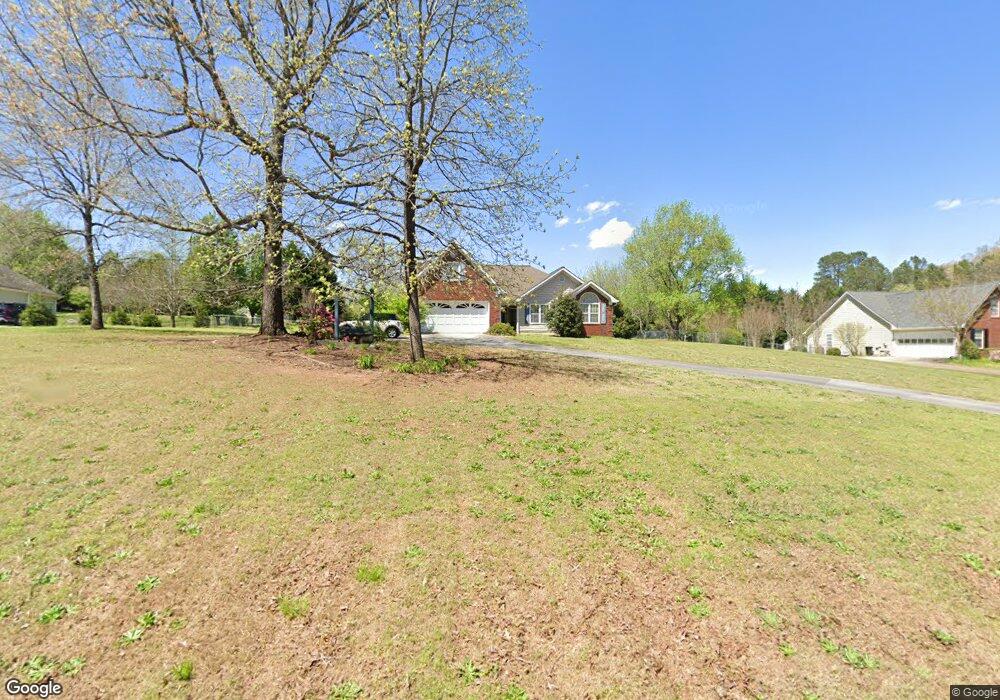
3255 Holly Stand Ct Loganville, GA 30052
Estimated Value: $344,000 - $369,000
--
Bed
--
Bath
1,832
Sq Ft
$196/Sq Ft
Est. Value
About This Home
This home is located at 3255 Holly Stand Ct, Loganville, GA 30052 and is currently estimated at $359,070, approximately $195 per square foot. 3255 Holly Stand Ct is a home located in Walton County with nearby schools including Bay Creek Elementary School, Loganville Middle School, and Loganville High School.
Ownership History
Date
Name
Owned For
Owner Type
Purchase Details
Closed on
Jan 9, 2019
Sold by
Hudson Paul Kenneth
Bought by
Hudson Paul Kenneth and Hudson Lauren Morris
Current Estimated Value
Purchase Details
Closed on
Dec 21, 2018
Sold by
Fannie Mae
Bought by
Hudson Paul Kenneth
Purchase Details
Closed on
Sep 4, 2018
Sold by
Phh Mtg Corp
Bought by
Federal National Mtg Association
Purchase Details
Closed on
May 25, 2007
Sold by
Littlefield Ricky O and Littlefield Connie
Bought by
Butker Susan W
Home Financials for this Owner
Home Financials are based on the most recent Mortgage that was taken out on this home.
Original Mortgage
$158,400
Interest Rate
6.12%
Mortgage Type
New Conventional
Purchase Details
Closed on
Mar 21, 2002
Sold by
Cox Hubert L
Bought by
Littlfield Ricky O and Littlfield Connie
Purchase Details
Closed on
Dec 15, 2000
Sold by
Harris Angela
Bought by
Cox Hubert L and Cox Myrtler
Purchase Details
Closed on
Aug 15, 1995
Sold by
Barber Stuart Aaron
Bought by
Harris Angela
Create a Home Valuation Report for This Property
The Home Valuation Report is an in-depth analysis detailing your home's value as well as a comparison with similar homes in the area
Home Values in the Area
Average Home Value in this Area
Purchase History
| Date | Buyer | Sale Price | Title Company |
|---|---|---|---|
| Hudson Paul Kenneth | -- | -- | |
| Hudson Paul Kenneth | -- | -- | |
| Federal National Mtg Association | $153,059 | -- | |
| Phh Mtg Corp | -- | -- | |
| Butker Susan W | $176,000 | -- | |
| Littlfield Ricky O | -- | -- | |
| Cox Hubert L | $129,500 | -- | |
| Harris Angela | $107,000 | -- |
Source: Public Records
Mortgage History
| Date | Status | Borrower | Loan Amount |
|---|---|---|---|
| Previous Owner | Butker Susan W | $158,400 | |
| Closed | Harris Angela | $0 |
Source: Public Records
Tax History Compared to Growth
Tax History
| Year | Tax Paid | Tax Assessment Tax Assessment Total Assessment is a certain percentage of the fair market value that is determined by local assessors to be the total taxable value of land and additions on the property. | Land | Improvement |
|---|---|---|---|---|
| 2024 | $3,726 | $126,388 | $21,200 | $105,188 |
| 2023 | $3,729 | $122,948 | $21,200 | $101,748 |
| 2022 | $3,398 | $107,468 | $18,400 | $89,068 |
| 2021 | $2,885 | $88,548 | $17,600 | $70,948 |
| 2020 | $2,622 | $78,468 | $14,800 | $63,668 |
| 2019 | $2,227 | $64,828 | $11,600 | $53,228 |
| 2018 | $2,168 | $64,828 | $11,600 | $53,228 |
| 2017 | $2,188 | $63,508 | $11,600 | $51,908 |
| 2016 | $2,066 | $60,844 | $11,600 | $49,244 |
| 2015 | $1,916 | $55,524 | $10,000 | $45,524 |
| 2014 | -- | $42,260 | $10,000 | $32,260 |
Source: Public Records
Map
Nearby Homes
- 4885 Watson Mill Ct
- 3971 Dean Grove Way
- 5363 Forest Dr
- 903 Creek Bottom Rd
- 619 Landing Way
- 932 Creek Bottom Rd Unit 1
- 5474 Forest Dr Unit 4
- 3661 Bay Cove Ct
- 209 Birchwood Dr
- 207 Birchwood Dr
- 905 Shannon Rd SW
- 3571 Coveside Ct
- 3847 Cove Top Ct
- 200 Birchwood Dr
- 606 Amanda Leigh Ct
- 642 Shady Willow Ln
- 5317 Highway 81
- 3245 Holly Stand Ct
- 3265 Holly Stand Ct
- 3235 Holly Stand Ct
- 4924 Watson Mill Ct
- 3254 Holly Stand Ct
- 3244 Holly Stand Ct
- 3325 Holly Stand Ct
- 3275 Holly Stand Ct
- 4904 Watson Mill Ct
- 3264 Holly Stand Ct
- 3234 Holly Stand Ct
- 3335 Holly Stand Ct
- 3274 Holly Stand Ct
- 3225 Holly Stand Ct
- 4925 Watson Mill Ct
- 4894 Watson Mill Ct
- 3345 Holly Stand Ct
- 3224 Holly Stand Ct
- 3215 Holly Stand Ct
- 4915 Watson Mill Ct