Estimated Value: $399,668 - $1,008,000
4
Beds
2
Baths
9,946
Sq Ft
$62/Sq Ft
Est. Value
About This Home
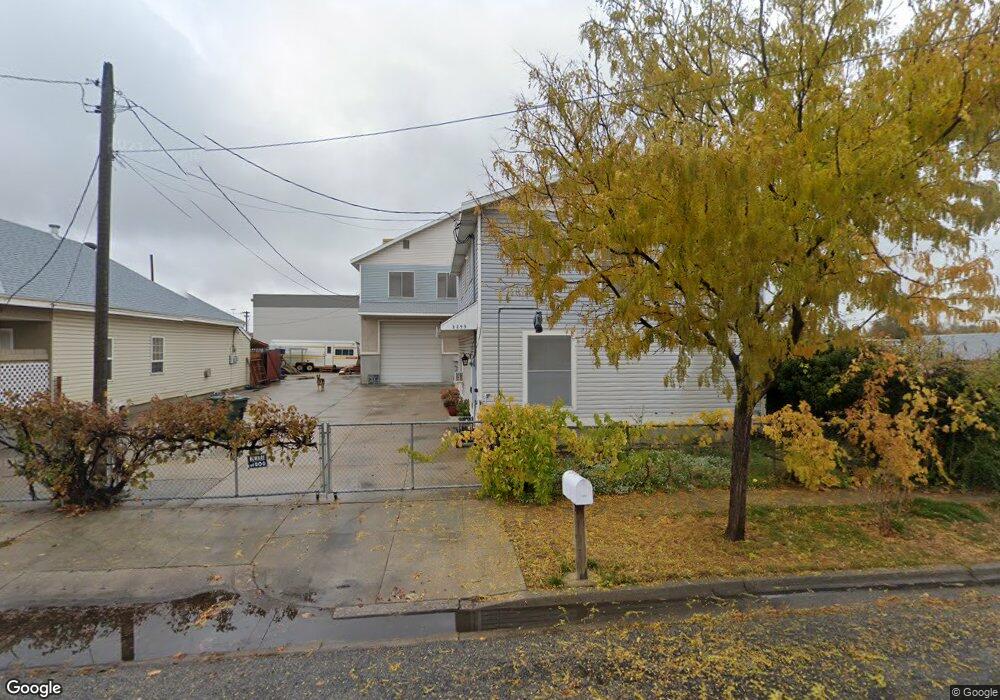
This home is located at 3255 Stephens Ave, Ogden, UT 84401 and is currently estimated at $617,417, approximately $62 per square foot. 3255 Stephens Ave is a home located in Weber County with nearby schools including Odyssey Elementary School, Mount Ogden Junior High School, and Ogden High School.
Ownership History
Date
Name
Owned For
Owner Type
Purchase Details
Closed on
Sep 6, 2024
Sold by
Brooks James P and Brooks Grace L
Bought by
Brooks James P
Current Estimated Value
Purchase Details
Closed on
Nov 16, 2023
Sold by
Brooks James P
Bought by
Brooks James P and Brooks Grace L
Purchase Details
Closed on
Jul 11, 2023
Sold by
Brooks Grace L and Brooks James P
Bought by
Brooks James P
Purchase Details
Closed on
May 17, 2023
Sold by
Brooks Grace L and Brooks James P
Bought by
Brooks Grace L and Brooks James P
Purchase Details
Closed on
Dec 28, 2021
Sold by
Brooks James P
Bought by
Brooks Grace L and Brooks James P
Purchase Details
Closed on
Aug 29, 2001
Sold by
Lopez Debra R
Bought by
Brooks James P
Purchase Details
Closed on
Jun 9, 1997
Sold by
Young June Ann
Bought by
Jrb Investments Inc
Purchase Details
Closed on
Mar 19, 1996
Sold by
J & J Investments
Bought by
J R B Investments Inc
Create a Home Valuation Report for This Property
The Home Valuation Report is an in-depth analysis detailing your home's value as well as a comparison with similar homes in the area
Purchase History
| Date | Buyer | Sale Price | Title Company |
|---|---|---|---|
| Brooks James P | -- | None Listed On Document | |
| Brooks James P | -- | None Listed On Document | |
| Brooks James P | -- | None Listed On Document | |
| Brooks Grace L | -- | None Listed On Document | |
| Brooks Grace L | -- | None Listed On Document | |
| Brooks James P | -- | -- | |
| Jrb Investments Inc | -- | -- | |
| J R B Investments Inc | -- | First American Title |
Source: Public Records
Tax History
| Year | Tax Paid | Tax Assessment Tax Assessment Total Assessment is a certain percentage of the fair market value that is determined by local assessors to be the total taxable value of land and additions on the property. | Land | Improvement |
|---|---|---|---|---|
| 2025 | $1,769 | $259,287 | $73,336 | $185,951 |
| 2024 | $1,757 | $139,147 | $40,334 | $98,813 |
| 2023 | $1,639 | $130,622 | $28,032 | $102,590 |
| 2022 | $1,577 | $229,000 | $42,473 | $186,527 |
| 2021 | $1,493 | $198,000 | $35,394 | $162,606 |
| 2020 | $1,543 | $189,000 | $28,315 | $160,685 |
| 2019 | $1,565 | $180,000 | $28,315 | $151,685 |
| 2018 | $1,499 | $171,278 | $28,315 | $142,963 |
| 2017 | $1,499 | $160,000 | $28,315 | $131,685 |
| 2015 | $1,456 | $81,950 | $12,459 | $69,491 |
| 2014 | $1,482 | $81,962 | $12,459 | $69,503 |
Source: Public Records
Map
Nearby Homes
- 3257 Stephens Ave
- 3265 Stephens Ave
- 3265 Stephens Ave
- 3267 Stephens Ave
- 3269 Stephens Ave
- 3246 Stephens Ave
- 3223 Stephens Ave
- 3242 Stephens Ave
- 3240 Stephens Ave
- 3236 Stephens Ave
- 3271 Stephens Ave
- 3241 Wall Ave
- 3230 Stephens Ave
- 3221 Stephens Ave
- 3226 Stephens Ave
- 3273 Stephens Ave
- 3218 Stephens Ave
- 3212 Stephens Ave
- 3277 Stephens Ave
- 3285 Stephens Ave
Your Personal Tour Guide
Ask me questions while you tour the home.