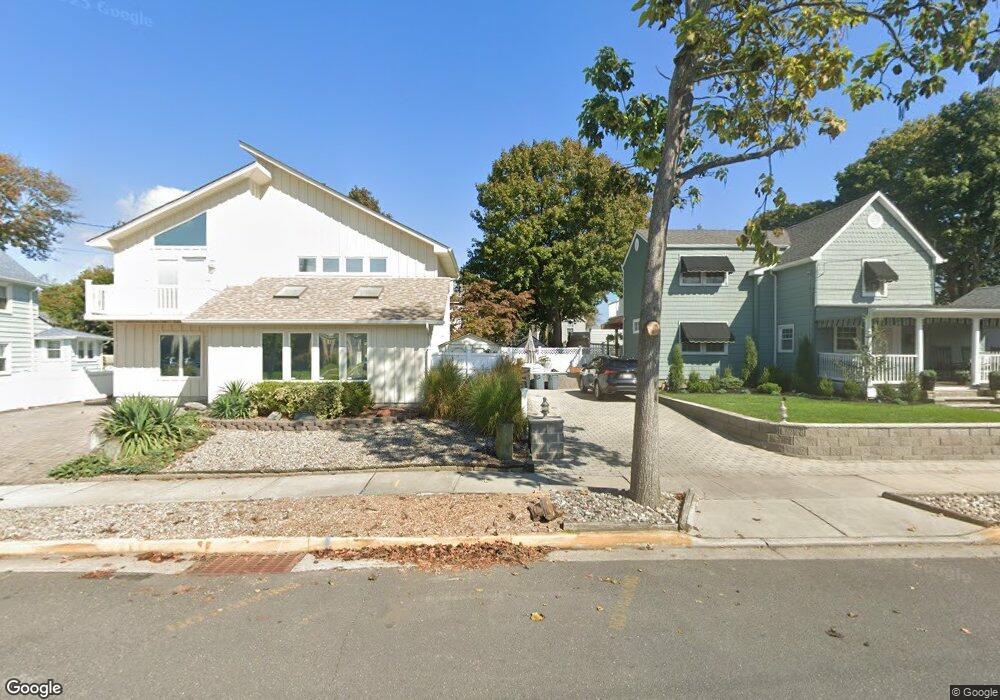
326 13th Ave Belmar, NJ 07719
Estimated Value: $933,000 - $1,289,000
3
Beds
2
Baths
1,512
Sq Ft
$737/Sq Ft
Est. Value
About This Home
This home is located at 326 13th Ave, Belmar, NJ 07719 and is currently estimated at $1,114,333, approximately $736 per square foot. 326 13th Ave is a home located in Monmouth County with nearby schools including Belmar Elementary School, St. Rose Grammar School, and St Rose High School.
Ownership History
Date
Name
Owned For
Owner Type
Purchase Details
Closed on
Jul 20, 2011
Sold by
Ketseas Polivios and Ketseas Donna
Bought by
Mardirosian Marcus
Current Estimated Value
Home Financials for this Owner
Home Financials are based on the most recent Mortgage that was taken out on this home.
Original Mortgage
$455,920
Outstanding Balance
$313,363
Interest Rate
4.49%
Mortgage Type
New Conventional
Estimated Equity
$800,970
Purchase Details
Closed on
Sep 14, 1995
Sold by
Weeks Gary
Bought by
Ketseas Polivios
Home Financials for this Owner
Home Financials are based on the most recent Mortgage that was taken out on this home.
Original Mortgage
$123,000
Interest Rate
7.89%
Purchase Details
Closed on
Jan 10, 1994
Sold by
Mcnicholas William
Bought by
Weeks Gary
Home Financials for this Owner
Home Financials are based on the most recent Mortgage that was taken out on this home.
Original Mortgage
$40,000
Interest Rate
7.23%
Create a Home Valuation Report for This Property
The Home Valuation Report is an in-depth analysis detailing your home's value as well as a comparison with similar homes in the area
Home Values in the Area
Average Home Value in this Area
Purchase History
| Date | Buyer | Sale Price | Title Company |
|---|---|---|---|
| Mardirosian Marcus | $569,900 | Foundation Title Llc | |
| Ketseas Polivios | $143,000 | -- | |
| Weeks Gary | $50,000 | -- |
Source: Public Records
Mortgage History
| Date | Status | Borrower | Loan Amount |
|---|---|---|---|
| Open | Mardirosian Marcus | $455,920 | |
| Previous Owner | Ketseas Polivios | $123,000 | |
| Previous Owner | Weeks Gary | $40,000 |
Source: Public Records
Tax History
| Year | Tax Paid | Tax Assessment Tax Assessment Total Assessment is a certain percentage of the fair market value that is determined by local assessors to be the total taxable value of land and additions on the property. | Land | Improvement |
|---|---|---|---|---|
| 2025 | $8,180 | $562,200 | $385,300 | $176,900 |
| 2024 | $7,905 | $562,200 | $385,300 | $176,900 |
| 2023 | $7,905 | $562,200 | $385,300 | $176,900 |
| 2022 | $7,629 | $562,200 | $385,300 | $176,900 |
| 2021 | $7,629 | $562,200 | $385,300 | $176,900 |
| 2020 | $7,562 | $562,200 | $385,300 | $176,900 |
| 2019 | $7,562 | $562,200 | $385,300 | $176,900 |
| 2018 | $6,943 | $562,200 | $385,300 | $176,900 |
| 2017 | $6,775 | $562,200 | $385,300 | $176,900 |
| 2016 | $6,358 | $332,700 | $165,300 | $167,400 |
| 2015 | $6,001 | $312,700 | $145,300 | $167,400 |
| 2014 | $6,438 | $332,700 | $165,300 | $167,400 |
Source: Public Records
Map
Nearby Homes
Your Personal Tour Guide
Ask me questions while you tour the home.