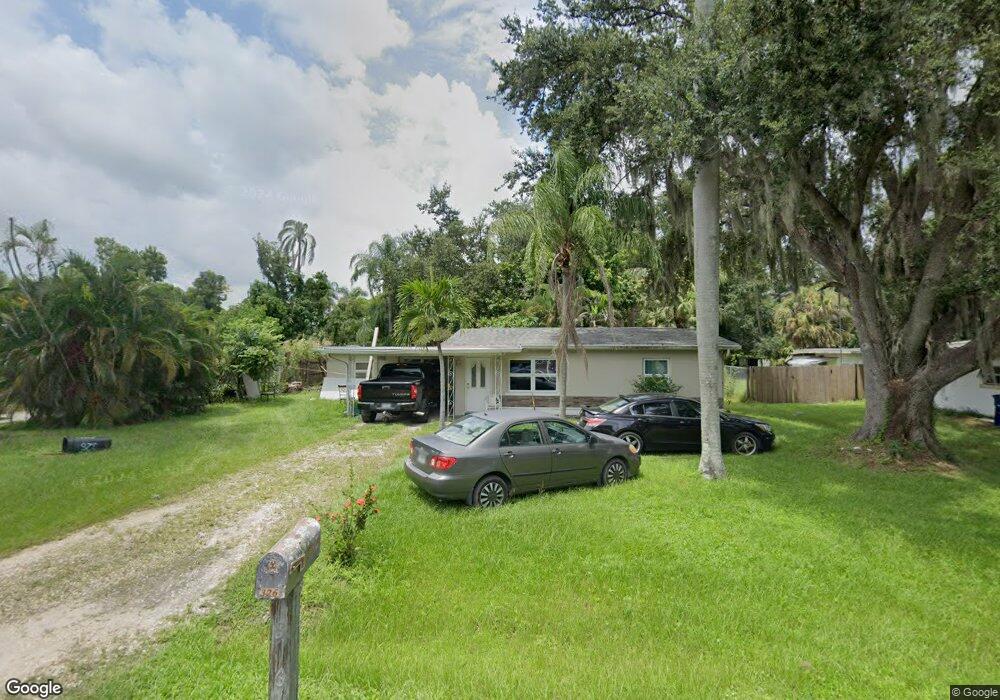
326 Chattanooga Dr Fort Myers, FL 33905
Estimated Value: $116,000 - $193,000
2
Beds
1
Bath
1,005
Sq Ft
$157/Sq Ft
Est. Value
About This Home
This home is located at 326 Chattanooga Dr, Fort Myers, FL 33905 and is currently estimated at $158,000, approximately $157 per square foot. 326 Chattanooga Dr is a home located in Lee County with nearby schools including Tice Elementary School, Orange River Elementary School, and Edgewood Academy.
Ownership History
Date
Name
Owned For
Owner Type
Purchase Details
Closed on
May 17, 2023
Sold by
Arete Holdings Llc
Bought by
Dl Rental Holding Llc
Current Estimated Value
Home Financials for this Owner
Home Financials are based on the most recent Mortgage that was taken out on this home.
Original Mortgage
$90,000
Outstanding Balance
$87,447
Interest Rate
6.28%
Mortgage Type
Construction
Estimated Equity
$70,553
Purchase Details
Closed on
Mar 23, 2016
Sold by
Morsch Leslie C
Bought by
Arete Holdings Llc
Purchase Details
Closed on
Aug 22, 2003
Sold by
Adenaike Bandele A and Olunuga Oluseun
Bought by
Morsch Leslie C
Home Financials for this Owner
Home Financials are based on the most recent Mortgage that was taken out on this home.
Original Mortgage
$72,000
Interest Rate
6.24%
Purchase Details
Closed on
Apr 22, 2003
Sold by
Brindley Joseph O
Bought by
Adenaike Bandele A and Olunuga Oluseun
Home Financials for this Owner
Home Financials are based on the most recent Mortgage that was taken out on this home.
Original Mortgage
$48,800
Interest Rate
5.86%
Create a Home Valuation Report for This Property
The Home Valuation Report is an in-depth analysis detailing your home's value as well as a comparison with similar homes in the area
Home Values in the Area
Average Home Value in this Area
Purchase History
| Date | Buyer | Sale Price | Title Company |
|---|---|---|---|
| Dl Rental Holding Llc | $95,000 | None Listed On Document | |
| Arete Holdings Llc | $60,000 | Premier Land Title Llc | |
| Morsch Leslie C | $80,000 | -- | |
| Adenaike Bandele A | $61,000 | -- |
Source: Public Records
Mortgage History
| Date | Status | Borrower | Loan Amount |
|---|---|---|---|
| Open | Dl Rental Holding Llc | $90,000 | |
| Previous Owner | Morsch Leslie C | $72,000 | |
| Previous Owner | Adenaike Bandele A | $48,800 |
Source: Public Records
Tax History Compared to Growth
Tax History
| Year | Tax Paid | Tax Assessment Tax Assessment Total Assessment is a certain percentage of the fair market value that is determined by local assessors to be the total taxable value of land and additions on the property. | Land | Improvement |
|---|---|---|---|---|
| 2025 | $2,283 | $111,766 | $49,459 | $60,531 |
| 2024 | $1,842 | $133,454 | $38,938 | $91,718 |
| 2023 | $1,842 | $94,634 | $0 | $0 |
| 2022 | $1,654 | $86,031 | $0 | $0 |
| 2021 | $1,454 | $78,210 | $9,050 | $69,160 |
| 2020 | $1,362 | $72,678 | $9,050 | $63,628 |
| 2019 | $1,273 | $67,829 | $8,575 | $59,254 |
| 2018 | $1,178 | $58,951 | $8,575 | $50,376 |
| 2017 | $1,189 | $58,948 | $7,800 | $51,148 |
| 2016 | $951 | $67,696 | $7,800 | $59,896 |
| 2015 | $677 | $33,197 | $6,750 | $26,447 |
| 2014 | $639 | $33,204 | $6,750 | $26,454 |
| 2013 | -- | $25,003 | $6,100 | $18,903 |
Source: Public Records
Map
Nearby Homes
- 305 Bellair Rd
- 312 Royal Palm Park Rd
- 345 Georgia Ln
- 4555 Auburn Ave
- 310 Balboa Ave
- 4566 Seminole St
- 4546 Tennessee Way
- 4567 E Riverside Dr
- 331 Balboa Ave
- 327 Montgomery Ave
- 372 Altamont Ave
- 274 Granada Blvd
- 4465 Birmingham St
- 280 Granada Blvd
- 4472 E Riverside Dr
- 4455 Birmingham St
- 219 Granada Blvd
- 4826 E Riverside Dr
- 407 Baltimore Ave
- 4438 E Riverside Dr
- 330 Chattanooga Dr
- 324 Chattanooga Dr
- 331 Royal Palm Park Rd
- 334 Chattanooga Dr
- 320 Chattanooga Dr
- 299 Chattanooga Dr
- 335/337 Royal Palm Park Rd
- 325 Chattanooga Dr
- 335 Royal Palm Park Rd Unit 337
- 325 Royal Palm Park Rd
- 331 Chattanooga Dr
- 336 Chattanooga Dr
- 327 Royal Palm Park Rd
- 323 Chattanooga Dr
- 316 Chattanooga Dr
- 319 Chattanooga Dr
- 321 Royal Palm Park Rd
- 339 Royal Palm Park Rd
- 338 Chattanooga Dr
- 340 Royal Palm Park Rd