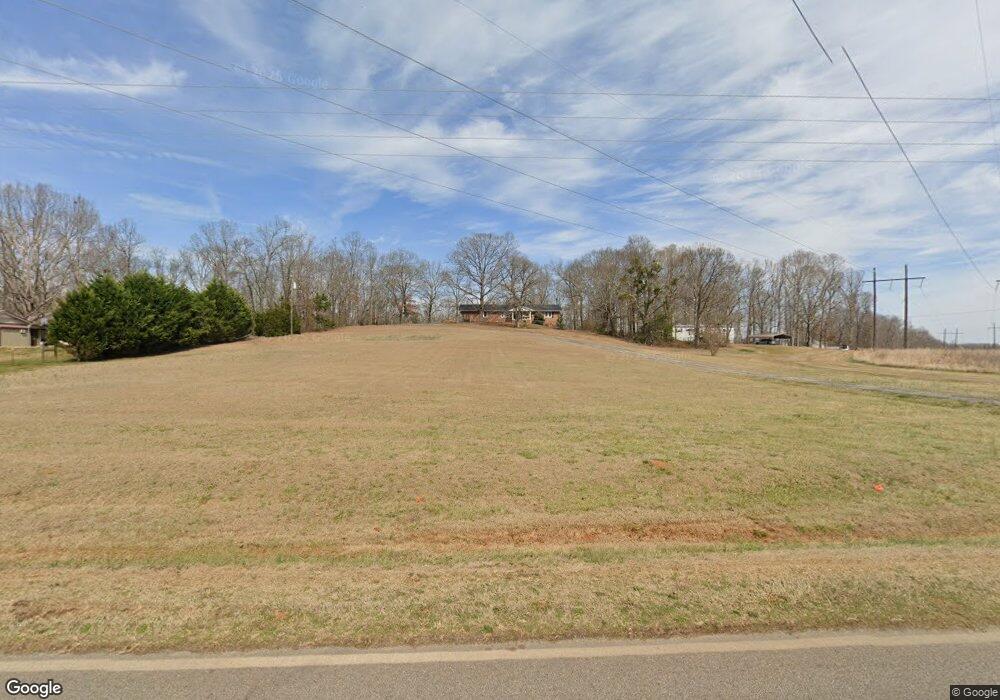
326 Cleghorne Rd Colbert, GA 30628
Estimated Value: $268,000 - $359,000
3
Beds
2
Baths
2,020
Sq Ft
$160/Sq Ft
Est. Value
About This Home
This home is located at 326 Cleghorne Rd, Colbert, GA 30628 and is currently estimated at $323,815, approximately $160 per square foot. 326 Cleghorne Rd is a home located in Madison County with nearby schools including Madison County High School.
Ownership History
Date
Name
Owned For
Owner Type
Purchase Details
Closed on
Feb 4, 2010
Sold by
Federal National Mortgage Association
Bought by
Davis James M and Davis Patricia A
Current Estimated Value
Home Financials for this Owner
Home Financials are based on the most recent Mortgage that was taken out on this home.
Original Mortgage
$112,917
Outstanding Balance
$74,881
Interest Rate
5.07%
Mortgage Type
FHA
Estimated Equity
$248,934
Purchase Details
Closed on
Sep 1, 2009
Sold by
Chase Home Finance Llc
Bought by
Federal National Mortgage Association
Purchase Details
Closed on
Jul 19, 2007
Sold by
Goode Kimberly M
Bought by
Goode Gary
Purchase Details
Closed on
Sep 25, 2002
Sold by
Borders Mae I
Bought by
Goode Kimberly M
Purchase Details
Closed on
Sep 23, 1982
Bought by
Borders Mae I
Create a Home Valuation Report for This Property
The Home Valuation Report is an in-depth analysis detailing your home's value as well as a comparison with similar homes in the area
Home Values in the Area
Average Home Value in this Area
Purchase History
| Date | Buyer | Sale Price | Title Company |
|---|---|---|---|
| Davis James M | -- | -- | |
| Federal National Mortgage Association | $213,138 | -- | |
| Chase Home Finance Llc | $213,138 | -- | |
| Goode Gary | -- | -- | |
| Goode Kimberly M | $157,800 | -- | |
| Borders Mae I | -- | -- | |
| Borders Mae I | -- | -- |
Source: Public Records
Mortgage History
| Date | Status | Borrower | Loan Amount |
|---|---|---|---|
| Open | Davis James M | $112,917 |
Source: Public Records
Tax History Compared to Growth
Tax History
| Year | Tax Paid | Tax Assessment Tax Assessment Total Assessment is a certain percentage of the fair market value that is determined by local assessors to be the total taxable value of land and additions on the property. | Land | Improvement |
|---|---|---|---|---|
| 2024 | $2,430 | $95,377 | $16,859 | $78,518 |
| 2023 | $2,675 | $87,642 | $14,049 | $73,593 |
| 2022 | $2,018 | $75,159 | $9,660 | $65,499 |
| 2021 | $1,799 | $60,922 | $9,660 | $51,262 |
| 2020 | $1,768 | $59,517 | $8,255 | $51,262 |
| 2019 | $1,757 | $58,502 | $8,255 | $50,247 |
| 2018 | $1,704 | $56,621 | $7,552 | $49,069 |
| 2017 | $1,598 | $55,508 | $7,025 | $48,483 |
| 2016 | $1,329 | $48,316 | $7,025 | $41,291 |
| 2015 | $1,330 | $48,316 | $7,025 | $41,291 |
| 2014 | $1,371 | $49,450 | $7,241 | $42,209 |
| 2013 | -- | $49,450 | $7,241 | $42,209 |
Source: Public Records
Map
Nearby Homes
- 3005 Highway 29 S
- 614 Holman-Autry Rd
- 1625 Highway 29 S
- 3965 Highway 29 S
- 599 Double Branch Rd
- 2888 Moons Grove Church Rd
- 50 Scout Hut Rd
- 0 Old Kincaid Rd Unit 10582354
- 0 Old Kincaid Rd Unit CL336310
- 74 Veterans Dr
- 14 Sourwood Trail Unit 53
- 235 Long Estates Dr
- 0 Veterans Dr Unit 10462434
- 0 Veterans Dr Unit 10462428
- 0 Veterans Dr Unit 10462425
- 0 Veterans Dr Unit 10462420
- 0 Veterans Dr Unit 10462408
- 0 Veterans Dr Unit 10462402
- 208 Redbud Trail Unit 48
- 45 Sugar Maple Way Unit 43
- 290 & 294 Cleghorne Rd
- 290 Cleghorne Rd
- 372 Cleghorne Rd
- 270 Cleghorne Rd
- 422 Cleghorne Rd
- 279 Cleghorne Rd
- 441 Cleghorne Rd
- 252 Cleghorne Rd
- 146 Cleghorne Rd
- 471 Cleghorne Rd
- 0 Cleghorne Rd Unit 7424738
- 0 Cleghorne Rd
- 2654 George Washington Ave
- 0 George Washington Ave Unit 3070166
- 2800 U S 29
- 2800 Highway 29 S
- 155 George Washington Ave
- 605 Cleghorne Rd
- S Highway 29
- 2950 Highway 29 S