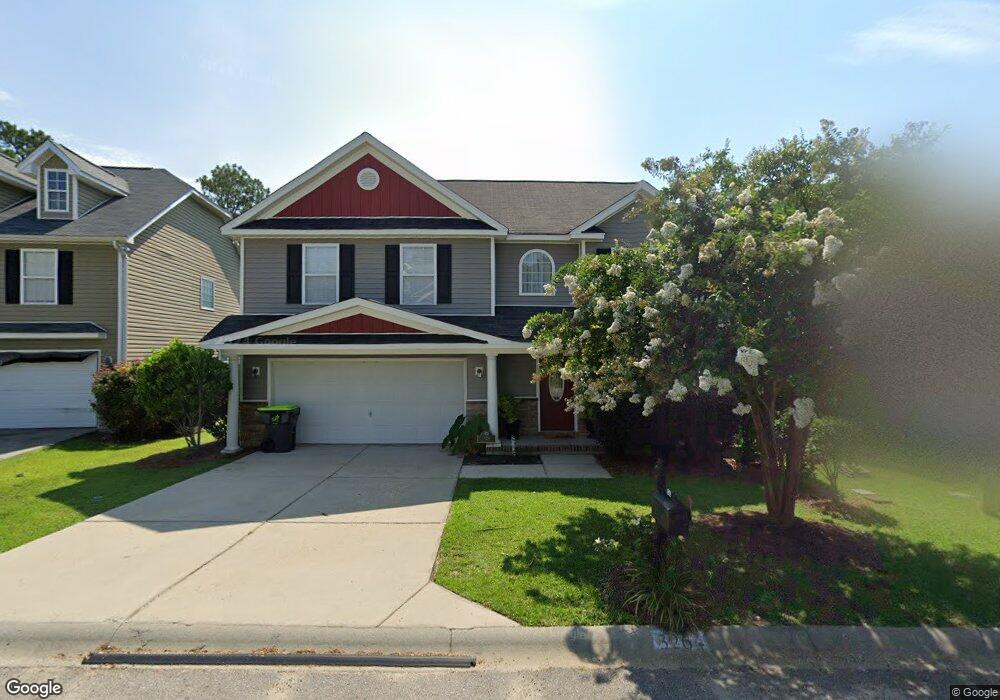
326 Conner Park Ln West Columbia, SC 29170
Estimated Value: $245,000 - $313,000
4
Beds
3
Baths
2,376
Sq Ft
$121/Sq Ft
Est. Value
About This Home
This home is located at 326 Conner Park Ln, West Columbia, SC 29170 and is currently estimated at $288,430, approximately $121 per square foot. 326 Conner Park Ln is a home located in Lexington County with nearby schools including Oak Grove Elementary School, White Knoll Middle School, and White Knoll High School.
Ownership History
Date
Name
Owned For
Owner Type
Purchase Details
Closed on
Aug 1, 2022
Sold by
Oneil Jackson Michael
Bought by
Powell Destiny L
Current Estimated Value
Home Financials for this Owner
Home Financials are based on the most recent Mortgage that was taken out on this home.
Original Mortgage
$245,471
Outstanding Balance
$235,231
Interest Rate
5.81%
Mortgage Type
FHA
Estimated Equity
$53,199
Purchase Details
Closed on
May 7, 2019
Sold by
Jackson Jessica Rollins
Bought by
Rollins Jackson Michaeloneil and Rollins Jackson Jessica
Purchase Details
Closed on
Oct 27, 2009
Sold by
Hurricane Construction Inc
Bought by
Rollins Jessica Paige
Home Financials for this Owner
Home Financials are based on the most recent Mortgage that was taken out on this home.
Original Mortgage
$147,184
Interest Rate
5.01%
Mortgage Type
FHA
Purchase Details
Closed on
Jun 1, 2009
Sold by
Tentium Development Llc
Bought by
Hurricane Construction Inc
Create a Home Valuation Report for This Property
The Home Valuation Report is an in-depth analysis detailing your home's value as well as a comparison with similar homes in the area
Home Values in the Area
Average Home Value in this Area
Purchase History
| Date | Buyer | Sale Price | Title Company |
|---|---|---|---|
| Powell Destiny L | $250,000 | Blair Cato Pickren Casterline | |
| Rollins Jackson Michaeloneil | -- | None Available | |
| Rollins Jessica Paige | $149,900 | -- | |
| Hurricane Construction Inc | $125,000 | -- |
Source: Public Records
Mortgage History
| Date | Status | Borrower | Loan Amount |
|---|---|---|---|
| Open | Powell Destiny L | $245,471 | |
| Previous Owner | Rollins Jessica Paige | $147,184 |
Source: Public Records
Tax History Compared to Growth
Tax History
| Year | Tax Paid | Tax Assessment Tax Assessment Total Assessment is a certain percentage of the fair market value that is determined by local assessors to be the total taxable value of land and additions on the property. | Land | Improvement |
|---|---|---|---|---|
| 2024 | $1,493 | $10,000 | $2,000 | $8,000 |
| 2023 | $1,493 | $6,604 | $939 | $5,665 |
| 2020 | $1,008 | $6,604 | $939 | $5,665 |
| 2019 | $892 | $5,742 | $1,000 | $4,742 |
| 2018 | $876 | $5,742 | $1,000 | $4,742 |
| 2017 | $849 | $5,742 | $1,000 | $4,742 |
| 2016 | $842 | $5,742 | $1,000 | $4,742 |
| 2014 | $859 | $6,114 | $1,000 | $5,114 |
| 2013 | -- | $6,110 | $1,000 | $5,110 |
Source: Public Records
Map
Nearby Homes
- 314 Conner Park Ln
- 117 Parkstone Way
- 170 Parkwood Dr
- 332 Montclaire Ln
- 254 Montclaire Cir
- 3827 Augusta Rd
- 133 Idlewood Cir
- 615 Cheehaw Ave
- 451 Kippen Ln
- 408 Kippen Ln
- Lot 4 Micala Dr
- Lot 3 Micala Dr
- Lot 2 Micala Dr
- Lot 1 Micala Dr
- 238 Oristo Ridge Way
- 539 Idlewood Park Dr
- 537 Idlewood Park Dr
- 504 Idlewood Park Dr
- 204 Bayberry Ct
- 114 Pebble Brook Rd
- 322 Conner Park Ln
- 330 Conner Park Ln
- 318 Conner Park Ln
- 334 Conner Park Ln
- 327 Conner Park Ln
- 323 Conner Park Ln
- 338 Conner Park Ln
- 319 Conner Park Ln
- 339 Conner Park Ln
- 315 Conner Park Ln
- 342 Conner Park Ln
- 310 Conner Park Ln
- 1435 Parkdale Dr
- 311 Conner Park Ln
- 278 Gardenwalk Dr
- 346 Conner Park Ln
- 306 Conner Park Ln
- 274 Gardenwalk Dr
- 307 Conner Park Ln
- 350 Conner Park Ln