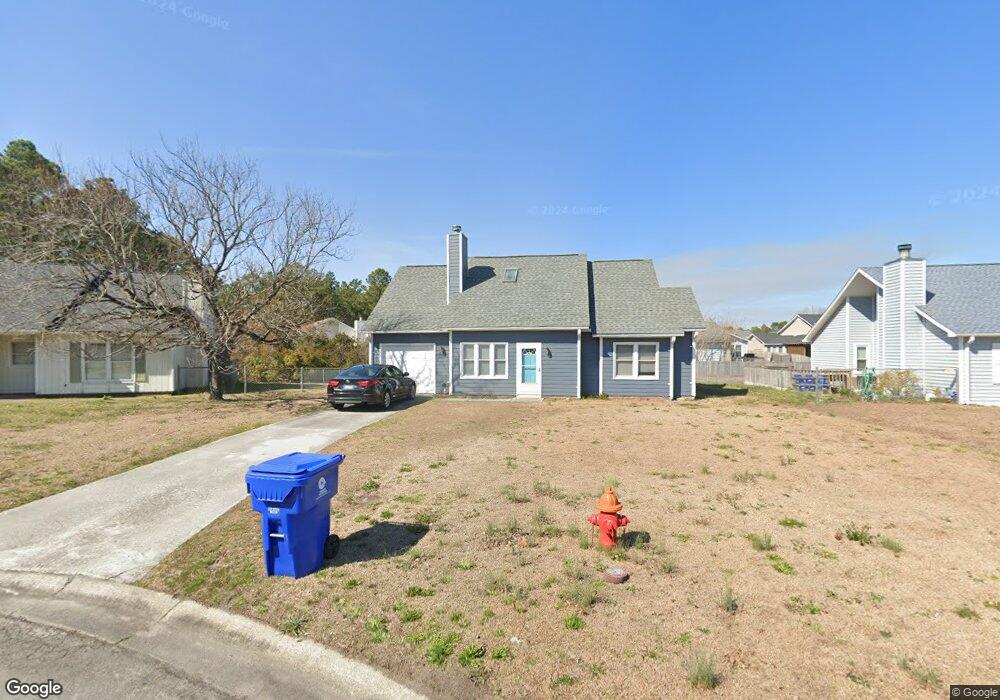
326 Deer Run Newport, NC 28570
Estimated Value: $261,000 - $271,000
4
Beds
2
Baths
1,590
Sq Ft
$168/Sq Ft
Est. Value
About This Home
This home is located at 326 Deer Run, Newport, NC 28570 and is currently estimated at $267,073, approximately $167 per square foot. 326 Deer Run is a home located in Carteret County with nearby schools including Newport Elementary School, Newport Middle School, and West Carteret High School.
Ownership History
Date
Name
Owned For
Owner Type
Purchase Details
Closed on
Jun 29, 2010
Sold by
Federal National Mortgage Association
Bought by
Blango Chun D and Blango Kimberly W
Current Estimated Value
Home Financials for this Owner
Home Financials are based on the most recent Mortgage that was taken out on this home.
Original Mortgage
$132,692
Outstanding Balance
$87,689
Interest Rate
4.61%
Mortgage Type
VA
Estimated Equity
$179,384
Purchase Details
Closed on
Dec 18, 2009
Sold by
Ludwig Ahren T and Ludwig Michelle L
Bought by
Federal National Mortgage Association
Purchase Details
Closed on
Jun 24, 2006
Sold by
Sanchez Eric and Sanchez Carolina
Bought by
Ludwig Ahren T and Smardz Ludwig Michelle L
Home Financials for this Owner
Home Financials are based on the most recent Mortgage that was taken out on this home.
Original Mortgage
$149,900
Interest Rate
6.57%
Mortgage Type
Purchase Money Mortgage
Purchase Details
Closed on
Oct 10, 2001
Purchase Details
Closed on
Aug 14, 2001
Create a Home Valuation Report for This Property
The Home Valuation Report is an in-depth analysis detailing your home's value as well as a comparison with similar homes in the area
Home Values in the Area
Average Home Value in this Area
Purchase History
| Date | Buyer | Sale Price | Title Company |
|---|---|---|---|
| Blango Chun D | -- | None Available | |
| Federal National Mortgage Association | $135,429 | None Available | |
| Ludwig Ahren T | $150,000 | None Available | |
| -- | -- | -- | |
| -- | -- | -- |
Source: Public Records
Mortgage History
| Date | Status | Borrower | Loan Amount |
|---|---|---|---|
| Open | Blango Chun D | $132,692 | |
| Previous Owner | Ludwig Ahren T | $149,900 |
Source: Public Records
Tax History Compared to Growth
Tax History
| Year | Tax Paid | Tax Assessment Tax Assessment Total Assessment is a certain percentage of the fair market value that is determined by local assessors to be the total taxable value of land and additions on the property. | Land | Improvement |
|---|---|---|---|---|
| 2025 | $685 | $260,725 | $33,031 | $227,694 |
| 2024 | $580 | $141,825 | $21,930 | $119,895 |
| 2023 | $497 | $141,825 | $21,930 | $119,895 |
| 2022 | $483 | $141,825 | $21,930 | $119,895 |
| 2021 | $483 | $141,825 | $21,930 | $119,895 |
| 2020 | $483 | $141,825 | $21,930 | $119,895 |
| 2019 | $441 | $137,319 | $20,124 | $117,195 |
| 2017 | $441 | $137,319 | $20,124 | $117,195 |
| 2016 | $441 | $137,319 | $20,124 | $117,195 |
| 2015 | $427 | $137,319 | $20,124 | $117,195 |
| 2014 | $447 | $143,849 | $39,206 | $104,643 |
Source: Public Records
Map
Nearby Homes
- 554 Chatham St
- 2211 Park Ave
- 730 Chatham St
- 202 Courtyard W
- 121 Pine Grove Rd
- 764 Chatham St
- 2101 S Lakeview Dr
- 2104 S Lakeview Dr
- 129 Bayberry Rd
- 690 Chatham St
- 2605 W Forest Dr
- 201 Diamond Cove Unit 201
- 100 Treasure Cove
- 110 Treasure Cove
- 223 Independence Blvd
- 2867 Easy St
- 307 Sweetwater Cove
- 143 Tradition Trail
- The Villas Plan at The Villas
- 251 Independence Blvd
- 328 Deer Run
- 324 Deer Run
- 608 Mourning Dove
- 606 Mourning Dove
- 330 Deer Run
- 322 Deer Run
- 610 Mourning Dove
- 309 Deer Run
- 604 Mourning Dove
- 320 Deer Run
- 332 Deer Run
- 602 Mourning Dove
- 307 Deer Run
- 318 Deer Run
- 612 Mourning Dove
- 311 Deer Run
- 600 Mourning Dove
- 316 Deer Run
- 611 Mourning Dove
- 609 Mourning Dove