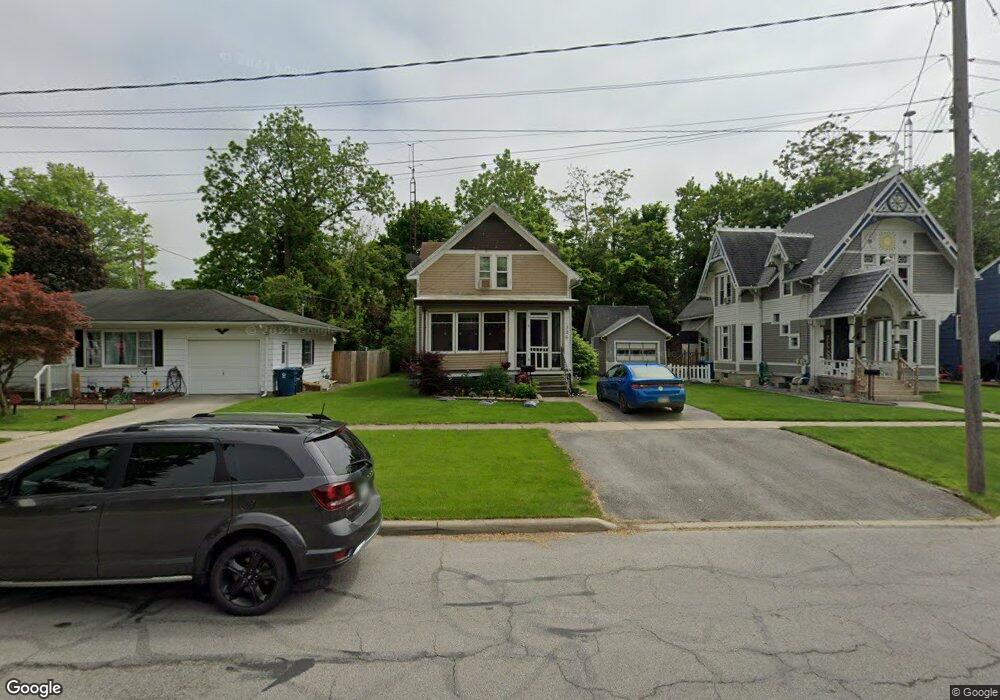
326 E 3rd St Port Clinton, OH 43452
Estimated Value: $139,575 - $180,000
3
Beds
1
Bath
1,159
Sq Ft
$140/Sq Ft
Est. Value
About This Home
This home is located at 326 E 3rd St, Port Clinton, OH 43452 and is currently estimated at $162,394, approximately $140 per square foot. 326 E 3rd St is a home located in Ottawa County with nearby schools including Bataan Memorial Primary School, Bataan Memorial Intermediate School, and Port Clinton Middle School.
Ownership History
Date
Name
Owned For
Owner Type
Purchase Details
Closed on
Jul 23, 2007
Sold by
Velliquette Elizabeth J
Bought by
Heschel Mary E
Current Estimated Value
Home Financials for this Owner
Home Financials are based on the most recent Mortgage that was taken out on this home.
Original Mortgage
$65,000
Outstanding Balance
$44,181
Interest Rate
8.25%
Mortgage Type
Seller Take Back
Estimated Equity
$118,213
Purchase Details
Closed on
Feb 14, 2003
Sold by
Velliquette Theodore J
Bought by
Velliquette Elizabeth J
Create a Home Valuation Report for This Property
The Home Valuation Report is an in-depth analysis detailing your home's value as well as a comparison with similar homes in the area
Home Values in the Area
Average Home Value in this Area
Purchase History
| Date | Buyer | Sale Price | Title Company |
|---|---|---|---|
| Heschel Mary E | $65,000 | Attorney | |
| Velliquette Elizabeth J | -- | -- |
Source: Public Records
Mortgage History
| Date | Status | Borrower | Loan Amount |
|---|---|---|---|
| Open | Heschel Mary E | $65,000 |
Source: Public Records
Tax History
| Year | Tax Paid | Tax Assessment Tax Assessment Total Assessment is a certain percentage of the fair market value that is determined by local assessors to be the total taxable value of land and additions on the property. | Land | Improvement |
|---|---|---|---|---|
| 2024 | $1,142 | $33,639 | $7,994 | $25,645 |
| 2023 | $1,165 | $25,127 | $4,571 | $20,556 |
| 2022 | $974 | $25,127 | $4,571 | $20,556 |
| 2021 | $974 | $25,130 | $4,570 | $20,560 |
| 2020 | $742 | $20,050 | $2,480 | $17,570 |
| 2019 | $734 | $20,050 | $2,480 | $17,570 |
| 2018 | $733 | $20,050 | $2,480 | $17,570 |
| 2017 | $719 | $19,370 | $2,480 | $16,890 |
| 2016 | $721 | $19,370 | $2,480 | $16,890 |
| 2015 | $724 | $19,370 | $2,480 | $16,890 |
| 2014 | $1,087 | $18,540 | $2,480 | $16,060 |
| 2013 | $700 | $18,540 | $2,480 | $16,060 |
Source: Public Records
Map
Nearby Homes
- 2621 N Peachtree Lane # Sublot 1
- 2453 N Peachtree Lane # Sublot 7
- 2481 N Peachtree Lane # Sublot 6
- 2565 N Peachtree Lane # Sublot 3
- 0 Mouse Island Unit 20252634
- 2369 N Peachtree Lane # Sublot 10
- 2397 N Peachtree Lane # Sublot 9
- 2509 N Peachtree Lane # Sublot 5
- 0 Mouse Island Unit 5139279
- 2425 N Peachtree Lane # Sublot 8
- 122 Washington St
- 521 E 2nd St
- 322 E 6th St
- 525 E 2nd St
- 801 E 3rd St
- 229 W 4th St
- 218 Elm St
- 302 W 2nd St
- 111 E 10th St
- 1011 E 2nd St
Your Personal Tour Guide
Ask me questions while you tour the home.