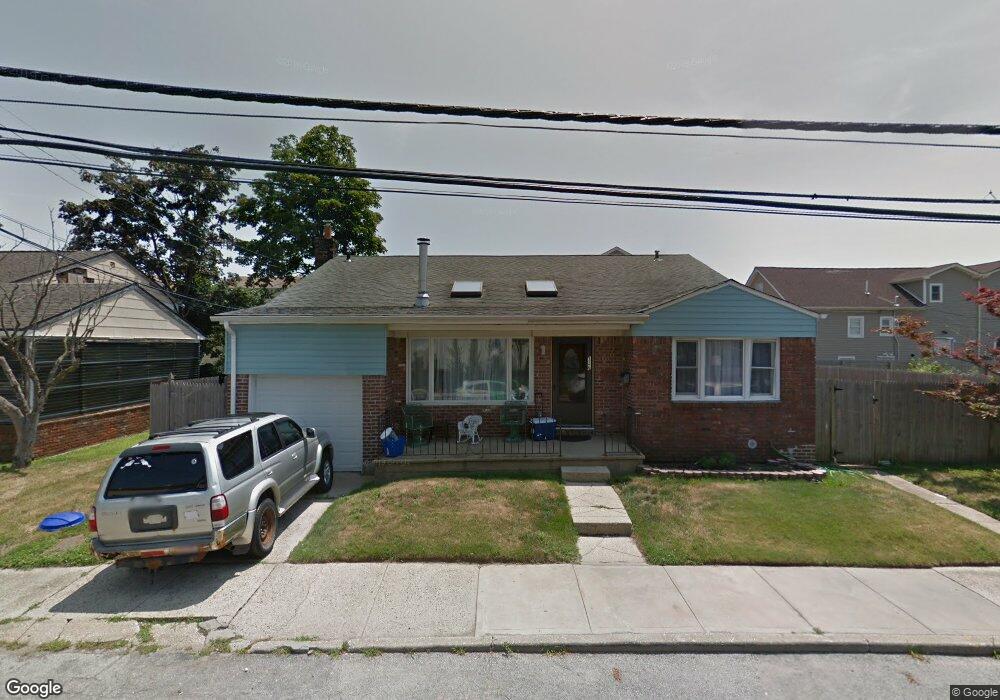
326 E Bay Dr Unit Lower Long Beach, NY 11561
Estimated Value: $735,000 - $821,851
4
Beds
1
Bath
1,253
Sq Ft
$621/Sq Ft
Est. Value
About This Home
This home is located at 326 E Bay Dr Unit Lower, Long Beach, NY 11561 and is currently estimated at $778,426, approximately $621 per square foot. 326 E Bay Dr Unit Lower is a home located in Nassau County with nearby schools including Lido Elementary School, East Elementary School, and Lindell Elementary School.
Ownership History
Date
Name
Owned For
Owner Type
Purchase Details
Closed on
Jan 24, 2022
Sold by
Woolfson Dana
Bought by
Milazzo Michael and Milazzo Amy
Current Estimated Value
Home Financials for this Owner
Home Financials are based on the most recent Mortgage that was taken out on this home.
Original Mortgage
$462,000
Outstanding Balance
$429,002
Interest Rate
3.55%
Mortgage Type
New Conventional
Estimated Equity
$349,424
Purchase Details
Closed on
Mar 21, 2017
Sold by
Lapenna Anthony
Bought by
Woolfson Dana
Home Financials for this Owner
Home Financials are based on the most recent Mortgage that was taken out on this home.
Original Mortgage
$294,000
Interest Rate
4.16%
Mortgage Type
New Conventional
Purchase Details
Closed on
Mar 26, 2002
Sold by
Saitta Robert
Bought by
Lapenna Anthony
Purchase Details
Closed on
May 12, 1998
Purchase Details
Closed on
Feb 7, 1995
Sold by
Carney James
Bought by
Green Lorraine Saitta Robert
Create a Home Valuation Report for This Property
The Home Valuation Report is an in-depth analysis detailing your home's value as well as a comparison with similar homes in the area
Home Values in the Area
Average Home Value in this Area
Purchase History
| Date | Buyer | Sale Price | Title Company |
|---|---|---|---|
| Milazzo Michael | $616,000 | First American Title | |
| Woolfson Dana | $420,000 | Judicial Title | |
| Lapenna Anthony | -- | Michael Ackerman | |
| -- | -- | -- | |
| Green Lorraine Saitta Robert | $181,000 | -- |
Source: Public Records
Mortgage History
| Date | Status | Borrower | Loan Amount |
|---|---|---|---|
| Open | Milazzo Michael | $462,000 | |
| Previous Owner | Woolfson Dana | $294,000 |
Source: Public Records
Tax History Compared to Growth
Tax History
| Year | Tax Paid | Tax Assessment Tax Assessment Total Assessment is a certain percentage of the fair market value that is determined by local assessors to be the total taxable value of land and additions on the property. | Land | Improvement |
|---|---|---|---|---|
| 2025 | $7,372 | $512 | $197 | $315 |
| 2024 | $847 | $493 | $190 | $303 |
| 2023 | $6,417 | $512 | $197 | $315 |
| 2022 | $6,417 | $512 | $197 | $315 |
| 2021 | $13,259 | $551 | $212 | $339 |
| 2020 | $5,519 | $588 | $464 | $124 |
| 2019 | $1,205 | $871 | $571 | $300 |
| 2018 | $1,264 | $871 | $0 | $0 |
| 2017 | $7,353 | $1,105 | $725 | $380 |
| 2016 | $1,364 | $1,105 | $725 | $380 |
| 2015 | $1,356 | $1,105 | $725 | $380 |
| 2014 | $1,356 | $1,105 | $725 | $380 |
| 2013 | $1,296 | $1,105 | $725 | $380 |
Source: Public Records
Map
Nearby Homes
- 709 Monroe Blvd
- 272 E Harrison St
- 347 E Pine St
- 340 E Pine St
- 342 E Fulton St
- 344 E Fulton St
- 360 E Hudson St
- 213 E Market St
- 100- 18 Baker Ct
- 228 E Market St
- 100 Baker Ct Unit 36
- 100 Baker Ct Unit 128
- 100 Baker Ct Unit 63
- 100 Baker Ct Unit 64
- 345 E Park Ave
- 460 E Market St
- 60 E Pine St
- 548 E State St
- 545 E Fulton St
- 169 Sunset Ave
- 326 E Bay Dr
- 326 E Bay Dr Unit Studio
- 329 E State St
- 330 E Bay Dr
- 318 E Bay Dr
- 335 E State St
- 317 E State St
- 337 E State St
- 310 E Bay Dr
- 311 E State St
- 348 E Bay Dr
- 345 E State St
- 330 E State St
- 326 E State St
- 334 E State St
- 334 E State St
- 336 E State St
- 316 E State St
- 338 E State St
- 718 Monroe Blvd