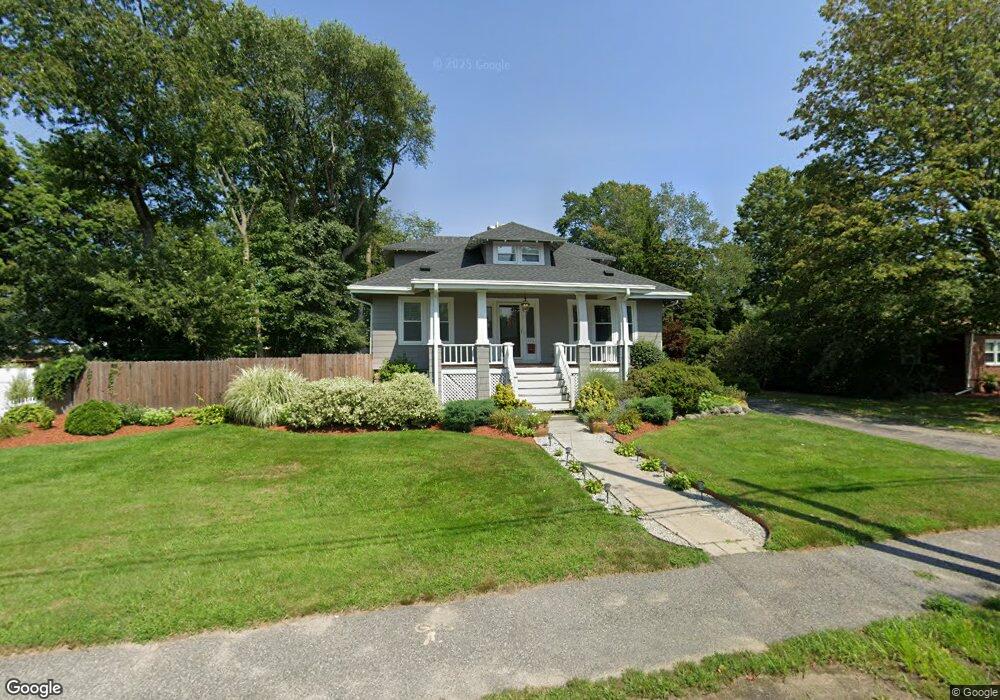
326 Front St Weymouth, MA 02188
Weymouth Landing NeighborhoodEstimated Value: $677,000 - $767,000
6
Beds
1
Bath
2,166
Sq Ft
$331/Sq Ft
Est. Value
About This Home
This home is located at 326 Front St, Weymouth, MA 02188 and is currently estimated at $717,144, approximately $331 per square foot. 326 Front St is a home located in Norfolk County with nearby schools including Frederick C Murphy, Abigail Adams Middle School, and Weymouth Middle School Chapman.
Ownership History
Date
Name
Owned For
Owner Type
Purchase Details
Closed on
Jul 25, 2011
Sold by
Zagrodny Marguerite I
Bought by
Schottmiller C A and Petit Kimberly J
Current Estimated Value
Home Financials for this Owner
Home Financials are based on the most recent Mortgage that was taken out on this home.
Original Mortgage
$274,550
Outstanding Balance
$188,704
Interest Rate
4.49%
Mortgage Type
Purchase Money Mortgage
Estimated Equity
$528,440
Create a Home Valuation Report for This Property
The Home Valuation Report is an in-depth analysis detailing your home's value as well as a comparison with similar homes in the area
Home Values in the Area
Average Home Value in this Area
Purchase History
| Date | Buyer | Sale Price | Title Company |
|---|---|---|---|
| Schottmiller C A | $289,000 | -- |
Source: Public Records
Mortgage History
| Date | Status | Borrower | Loan Amount |
|---|---|---|---|
| Open | Schottmiller C A | $274,550 |
Source: Public Records
Tax History Compared to Growth
Tax History
| Year | Tax Paid | Tax Assessment Tax Assessment Total Assessment is a certain percentage of the fair market value that is determined by local assessors to be the total taxable value of land and additions on the property. | Land | Improvement |
|---|---|---|---|---|
| 2025 | $6,046 | $598,600 | $230,100 | $368,500 |
| 2024 | $5,862 | $570,800 | $219,100 | $351,700 |
| 2023 | $5,667 | $542,300 | $202,900 | $339,400 |
| 2022 | $5,527 | $482,300 | $187,900 | $294,400 |
| 2021 | $5,112 | $435,400 | $187,900 | $247,500 |
| 2020 | $4,929 | $413,500 | $187,900 | $225,600 |
| 2019 | $4,812 | $397,000 | $180,700 | $216,300 |
| 2018 | $4,668 | $373,400 | $172,100 | $201,300 |
| 2017 | $4,236 | $330,700 | $163,900 | $166,800 |
| 2016 | $3,812 | $297,800 | $157,600 | $140,200 |
| 2015 | $3,753 | $290,900 | $157,600 | $133,300 |
| 2014 | $3,664 | $275,500 | $146,700 | $128,800 |
Source: Public Records
Map
Nearby Homes
- 54 Federal St
- 24 Blake Rd
- 33 Congress St
- 76 Kingman St
- 16 Lindbergh Ave
- 23-25 Lindbergh Ave
- 15 Summer St
- 19 Vine St Unit 3
- 19 Vine St Unit 1
- 114 Broad St Unit D
- 114 Broad St Unit C
- 11 Richmond St
- 122 Washington St Unit 22
- 286 Broad St
- 12 Klasson Ln
- 42 Sundin Rd
- 200 Justin Dr Unit 3
- 286 Essex St
- 449 Middle St
- 36 Brookside Rd