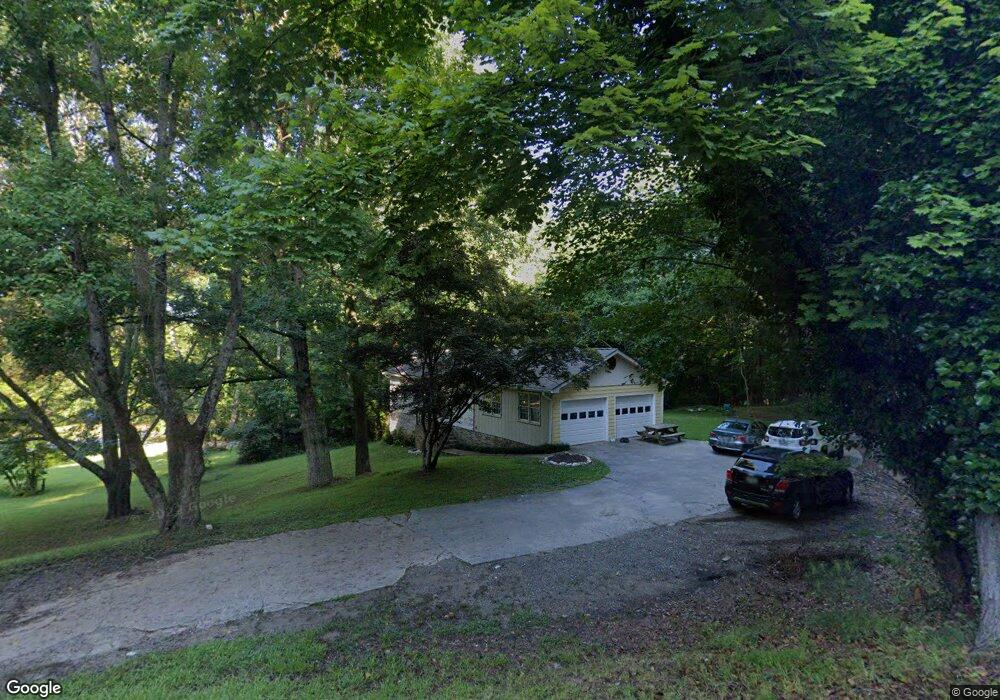
326 Happy Hollow Rd Dahlonega, GA 30533
Estimated Value: $321,695 - $359,000
3
Beds
2
Baths
2,586
Sq Ft
$132/Sq Ft
Est. Value
About This Home
This home is located at 326 Happy Hollow Rd, Dahlonega, GA 30533 and is currently estimated at $341,424, approximately $132 per square foot. 326 Happy Hollow Rd is a home located in Lumpkin County with nearby schools including Clay County Middle School and Lumpkin County High School.
Ownership History
Date
Name
Owned For
Owner Type
Purchase Details
Closed on
Dec 23, 2021
Sold by
Mila Maria
Bought by
Stalemark Greg
Current Estimated Value
Purchase Details
Closed on
Aug 11, 2021
Sold by
Shaffer Mary
Bought by
Mila Maria
Purchase Details
Closed on
Oct 7, 2014
Sold by
Steffes David A
Bought by
Shaffer Mary Lawrence
Purchase Details
Closed on
Aug 23, 2006
Sold by
Not Provided
Bought by
Steffes David A
Purchase Details
Closed on
Feb 10, 2006
Sold by
Not Provided
Bought by
Steffes David A
Purchase Details
Closed on
Jun 20, 1997
Sold by
Rae Lynn
Bought by
Harmon Gregory L
Purchase Details
Closed on
Jun 26, 1992
Sold by
Virginia
Bought by
Picklesimer Bob
Purchase Details
Closed on
Jul 1, 1985
Bought by
Caruso Anthony J
Create a Home Valuation Report for This Property
The Home Valuation Report is an in-depth analysis detailing your home's value as well as a comparison with similar homes in the area
Home Values in the Area
Average Home Value in this Area
Purchase History
| Date | Buyer | Sale Price | Title Company |
|---|---|---|---|
| Stalemark Greg | $226,000 | -- | |
| Mila Maria | $91,992 | -- | |
| Shaffer Mary Lawrence | $139,000 | -- | |
| Steffes David A | -- | -- | |
| Steffes David A | $144,000 | -- | |
| Harmon Gregory L | $80,000 | -- | |
| Picklesimer Bob | $62,000 | -- | |
| Caruso Anthony J | -- | -- |
Source: Public Records
Mortgage History
| Date | Status | Borrower | Loan Amount |
|---|---|---|---|
| Closed | Steffes David A | $0 |
Source: Public Records
Tax History Compared to Growth
Tax History
| Year | Tax Paid | Tax Assessment Tax Assessment Total Assessment is a certain percentage of the fair market value that is determined by local assessors to be the total taxable value of land and additions on the property. | Land | Improvement |
|---|---|---|---|---|
| 2024 | $3,257 | $112,760 | $13,656 | $99,104 |
| 2023 | $3,049 | $105,776 | $13,656 | $92,120 |
| 2022 | $2,762 | $93,391 | $13,656 | $79,735 |
| 2021 | $2,076 | $63,635 | $13,656 | $49,979 |
| 2020 | $2,118 | $62,496 | $13,656 | $48,840 |
| 2019 | $2,129 | $62,496 | $13,656 | $48,840 |
| 2018 | $2,052 | $56,378 | $13,656 | $42,722 |
| 2017 | $2,088 | $56,426 | $13,656 | $42,770 |
| 2016 | $2,021 | $53,426 | $13,656 | $39,770 |
| 2015 | $1,767 | $53,426 | $13,656 | $39,770 |
| 2014 | $1,767 | $54,579 | $13,656 | $40,923 |
| 2013 | -- | $55,732 | $13,656 | $42,076 |
Source: Public Records
Map
Nearby Homes
- 399 N Chestatee St
- 315 Church St
- 168 W Main St
- 95 Jones St
- 0 S Chestatee St Unit 10619536
- 490 N Hall Rd
- 0 Highway 19 N Unit 10594984
- 22 Honeysuckle Ln
- 1392 S Chestatee St
- 94 Mountain View Dr
- 0 Dawsonville Hwy Unit 10631159
- 00 Dawsonville Hwy
- 0 Calhoun Rd Unit 7643314
- 0 Calhoun Rd Unit 10598012
- 00 Calhoun Rd
- 120 Riley Rd
- 0 Crown Mountain Unit 7682225
- 0 Crown Mountain Unit 10644759
- 329 Morrison Moore Pkwy E
- 0 Highway 9 S Unit 10487179
- 382 Happy Hollow Rd
- 319 Happy Hollow Rd
- 339 Happy Hollow Rd
- 355 Happy Hollow Rd
- 261 Happy Hollow Rd
- 381 Happy Hollow Rd
- 268 Happy Hollow Rd
- 304 Happy Hollow Rd
- 252 Happy Hollow Rd
- 423 Happy Hollow Rd
- 339 N Chestatee St
- 244 Happy Hollow Rd
- 113 Haven Ct
- 103 Haven Ct
- 426 Happy Hollow Rd
- 223 Happy Hollow Rd
- 210 Happy Hollow Rd
- 449 Happy Hollow Rd
- 449 Happy
- 486 Happy Hollow Rd