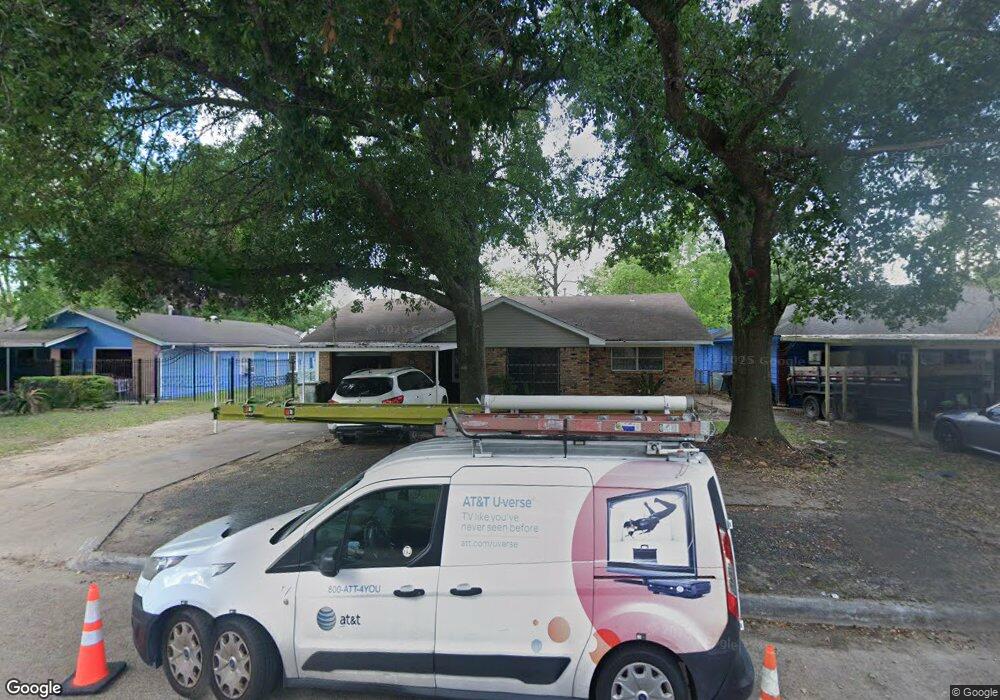
326 Ishmeal St Houston, TX 77091
Northside-Northline NeighborhoodEstimated Value: $184,882 - $260,000
3
Beds
1
Bath
1,138
Sq Ft
$199/Sq Ft
Est. Value
About This Home
This home is located at 326 Ishmeal St, Houston, TX 77091 and is currently estimated at $226,471, approximately $199 per square foot. 326 Ishmeal St is a home located in Harris County with nearby schools including Wesley Elementary School, Williams Middle, and Booker T Washington Sr High.
Ownership History
Date
Name
Owned For
Owner Type
Purchase Details
Closed on
Oct 8, 2018
Sold by
Tapia Arcelia
Bought by
Varela Pedro Robles
Current Estimated Value
Home Financials for this Owner
Home Financials are based on the most recent Mortgage that was taken out on this home.
Original Mortgage
$48,000
Outstanding Balance
$17,156
Interest Rate
4.5%
Mortgage Type
Seller Take Back
Estimated Equity
$209,315
Purchase Details
Closed on
Feb 29, 2016
Sold by
Pimentel Mancilla Talia and Pimental Talia
Bought by
Garcia Rafaela Mancilla and Pimentel Martin
Purchase Details
Closed on
Nov 29, 2010
Sold by
Robinson Robert
Bought by
Pimentel Mancilla Talia
Purchase Details
Closed on
May 28, 2008
Sold by
Smith Erma
Bought by
Robinson Robert
Purchase Details
Closed on
May 6, 2008
Sold by
King Evelyn T
Bought by
Smith Erma
Create a Home Valuation Report for This Property
The Home Valuation Report is an in-depth analysis detailing your home's value as well as a comparison with similar homes in the area
Home Values in the Area
Average Home Value in this Area
Purchase History
| Date | Buyer | Sale Price | Title Company |
|---|---|---|---|
| Varela Pedro Robles | -- | North Star Title Company | |
| Garcia Rafaela Mancilla | -- | North Start Title Co | |
| Pimentel Mancilla Talia | -- | North Star Title Company | |
| Robinson Robert | -- | None Available | |
| Smith Erma | -- | None Available |
Source: Public Records
Mortgage History
| Date | Status | Borrower | Loan Amount |
|---|---|---|---|
| Open | Varela Pedro Robles | $48,000 |
Source: Public Records
Tax History Compared to Growth
Tax History
| Year | Tax Paid | Tax Assessment Tax Assessment Total Assessment is a certain percentage of the fair market value that is determined by local assessors to be the total taxable value of land and additions on the property. | Land | Improvement |
|---|---|---|---|---|
| 2025 | $4,057 | $193,894 | $78,900 | $114,994 |
| 2024 | $4,057 | $193,894 | $78,900 | $114,994 |
| 2023 | $4,057 | $184,285 | $78,900 | $105,385 |
| 2022 | $3,002 | $136,350 | $55,230 | $81,120 |
| 2021 | $3,101 | $133,038 | $55,230 | $77,808 |
| 2020 | $3,015 | $124,505 | $55,230 | $69,275 |
| 2019 | $2,838 | $112,163 | $39,450 | $72,713 |
| 2018 | $1,943 | $76,790 | $11,835 | $64,955 |
| 2017 | $1,942 | $76,790 | $11,835 | $64,955 |
| 2016 | $1,942 | $76,790 | $11,835 | $64,955 |
| 2015 | $1,782 | $69,323 | $11,835 | $57,488 |
| 2014 | $1,782 | $69,323 | $11,835 | $57,488 |
Source: Public Records
Map
Nearby Homes
- 327 Yale Oaks Ln
- 406 Red Ripple Rd
- 427 Yale Oaks Ln
- 334 Yale Oaks Ln
- 410 Yale Oaks Ln
- 422 Yale Oaks Ln
- 434 Yale Oaks Ln
- 6057 Yale St
- 422 Surratt Dr
- 304 W Hamilton Lot B St
- 304 W St
- 304 W St E
- 201 W Rosamond St Unit 41
- 201 W Rosamond St Unit 53
- 201 W Rosamond St Unit 61
- 302 W Hamilton St
- 522 Surratt Dr
- 6100 Stuebner Airline Rd
- 304 W Hamilton Lot C St
- 615 Northew St Unit J
- 330 Ishmeal St
- 322 Ishmeal St
- 318 Ishmeal St
- 334 Ishmeal St
- 323 Red Ripple Rd
- 319 Red Ripple Rd
- 327 Red Ripple Rd
- 315 Red Ripple Rd
- 314 Ishmeal St
- 338 Ishmeal St
- 331 Red Ripple Rd
- 327 Ishmeal St
- 323 Ishmeal St
- 331 Ishmeal St
- 311 Red Ripple Rd
- 319 Ishmeal St
- 335 Ishmeal St
- 335 Red Ripple Rd
- 310 Ishmeal St
- 342 Ishmeal St